Fig. 5
Download original image
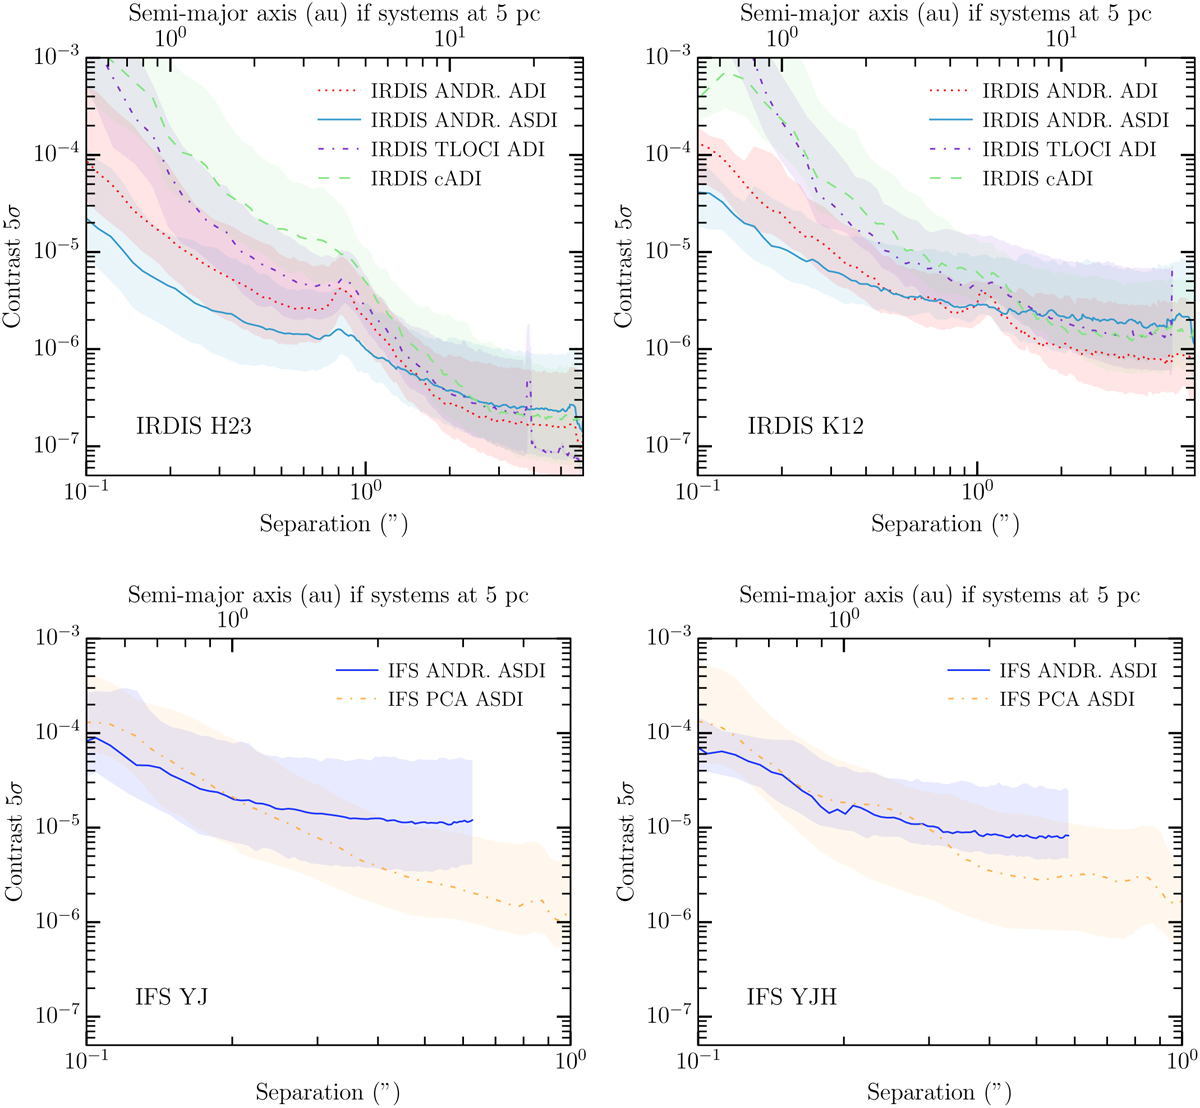
Sensitivity of our observations in terms of contrast with respect to the host star for the whole survey. Top panels: detection limits from SPHERE-IRDIS in the H23 (on the left) and K12 (on the right) bands for ANDROMEDA-ADI, ANDROMEDA-ASDI, SpeCal-TLOCI ADI and SpeCal-cADI post-processing. Bottom panels: detection limits from SPHERE-IFS in YJ (on the left) and in YJH (on the right) for ANDROMEDA-ASDI and SpeCal-PCA-ASDI reductions. The detection limits are given as a function of the separation to the star, also expressed as semi-major axis for systems located at 5 pc, following semi-major axis (au) = separation (") × distance (pc).
Current usage metrics show cumulative count of Article Views (full-text article views including HTML views, PDF and ePub downloads, according to the available data) and Abstracts Views on Vision4Press platform.
Data correspond to usage on the plateform after 2015. The current usage metrics is available 48-96 hours after online publication and is updated daily on week days.
Initial download of the metrics may take a while.