Fig. 4
Download original image
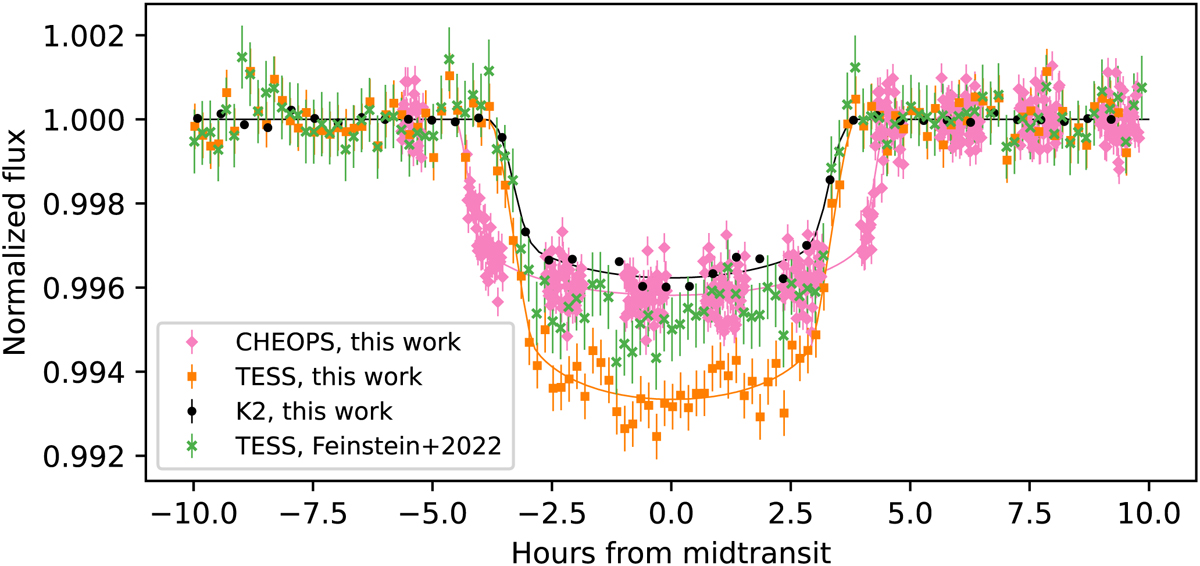
Comparison of the detrended transit LCs discussed in this work as seen by Kepler/K2, TESS and CHEOPS. For each dataset, the best-fit transit model is shown by curves with the same colour as the data points. The green data points identify the detrended and flattened TESS light curve analysed by Feinstein et al. (2022), obtained from the jupyter notebook made publicly available by the authors online (https://github.com/afeinstein20/v1298tau_tess/blob/main/notebooks/TESS_V1298Tau.ipynb).
Current usage metrics show cumulative count of Article Views (full-text article views including HTML views, PDF and ePub downloads, according to the available data) and Abstracts Views on Vision4Press platform.
Data correspond to usage on the plateform after 2015. The current usage metrics is available 48-96 hours after online publication and is updated daily on week days.
Initial download of the metrics may take a while.