Open Access
Fig. 8
Download original image
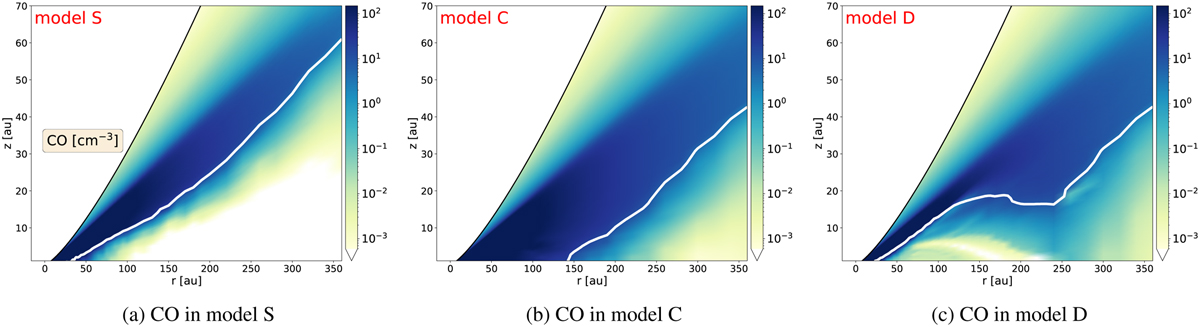
2D maps of CO gas number density [cm−3]. Left: CO in model S. Middle: CO in model C. Right: CO in model D. The solid white line corresponds to the CO snowline where ng(CO)/(ngas(CO)+nice(CO)) = 0.5. The black line shows the maximum scale height below which chemistry is computed.
Current usage metrics show cumulative count of Article Views (full-text article views including HTML views, PDF and ePub downloads, according to the available data) and Abstracts Views on Vision4Press platform.
Data correspond to usage on the plateform after 2015. The current usage metrics is available 48-96 hours after online publication and is updated daily on week days.
Initial download of the metrics may take a while.