Fig. 5
Download original image
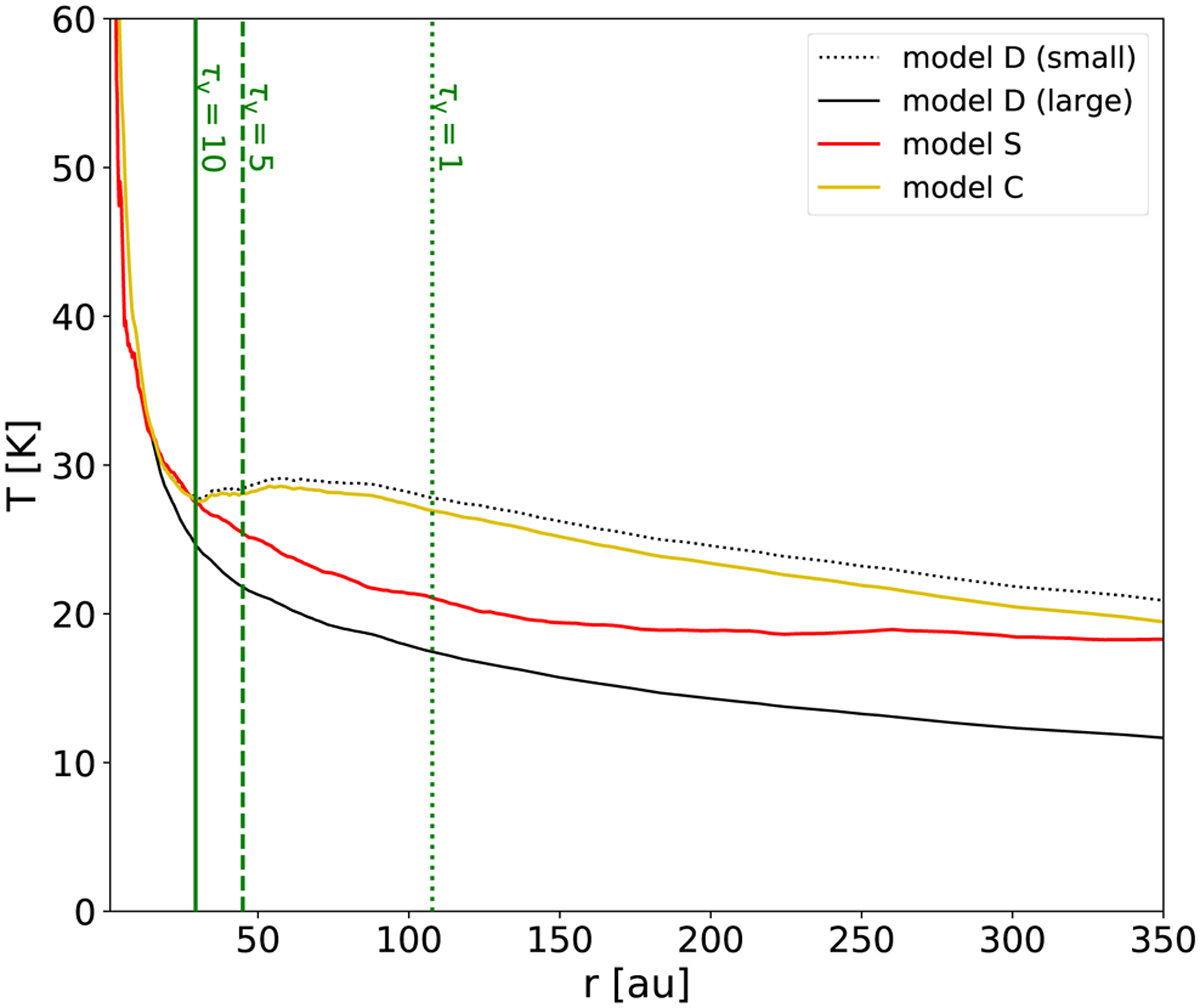
Disk midplane radial profiles of the dust temperatures. The black curves show the temperature profiles of model D. The solid red curve shows the temperature profile of model S, and the yellow curve shows that of model C. The vertical solid, dashed, and dotted green lines represent the radial distances in model D at which the vertical optical depth (at 1 µm) becomes smaller than 10, 5, and 1, respectively.
Current usage metrics show cumulative count of Article Views (full-text article views including HTML views, PDF and ePub downloads, according to the available data) and Abstracts Views on Vision4Press platform.
Data correspond to usage on the plateform after 2015. The current usage metrics is available 48-96 hours after online publication and is updated daily on week days.
Initial download of the metrics may take a while.