Fig. 12
Download original image
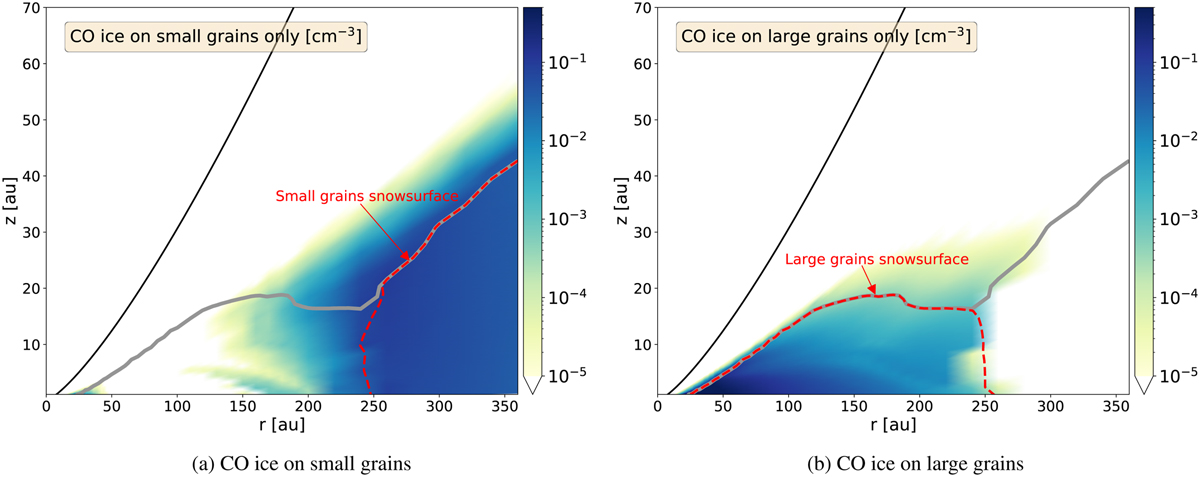
2D maps of CO ice number density (cm−3) in model D. Left: CO ice adsorbed onto the small dust population only. Right: CO ice adsorbed onto the large dust population only. The solid gray line corresponds to the total CO snowline. The dashed red lines correspond to the snowline of each population independently. The black line is the maximum scale height below which chemistry is computed.
Current usage metrics show cumulative count of Article Views (full-text article views including HTML views, PDF and ePub downloads, according to the available data) and Abstracts Views on Vision4Press platform.
Data correspond to usage on the plateform after 2015. The current usage metrics is available 48-96 hours after online publication and is updated daily on week days.
Initial download of the metrics may take a while.