Fig. 10
Download original image
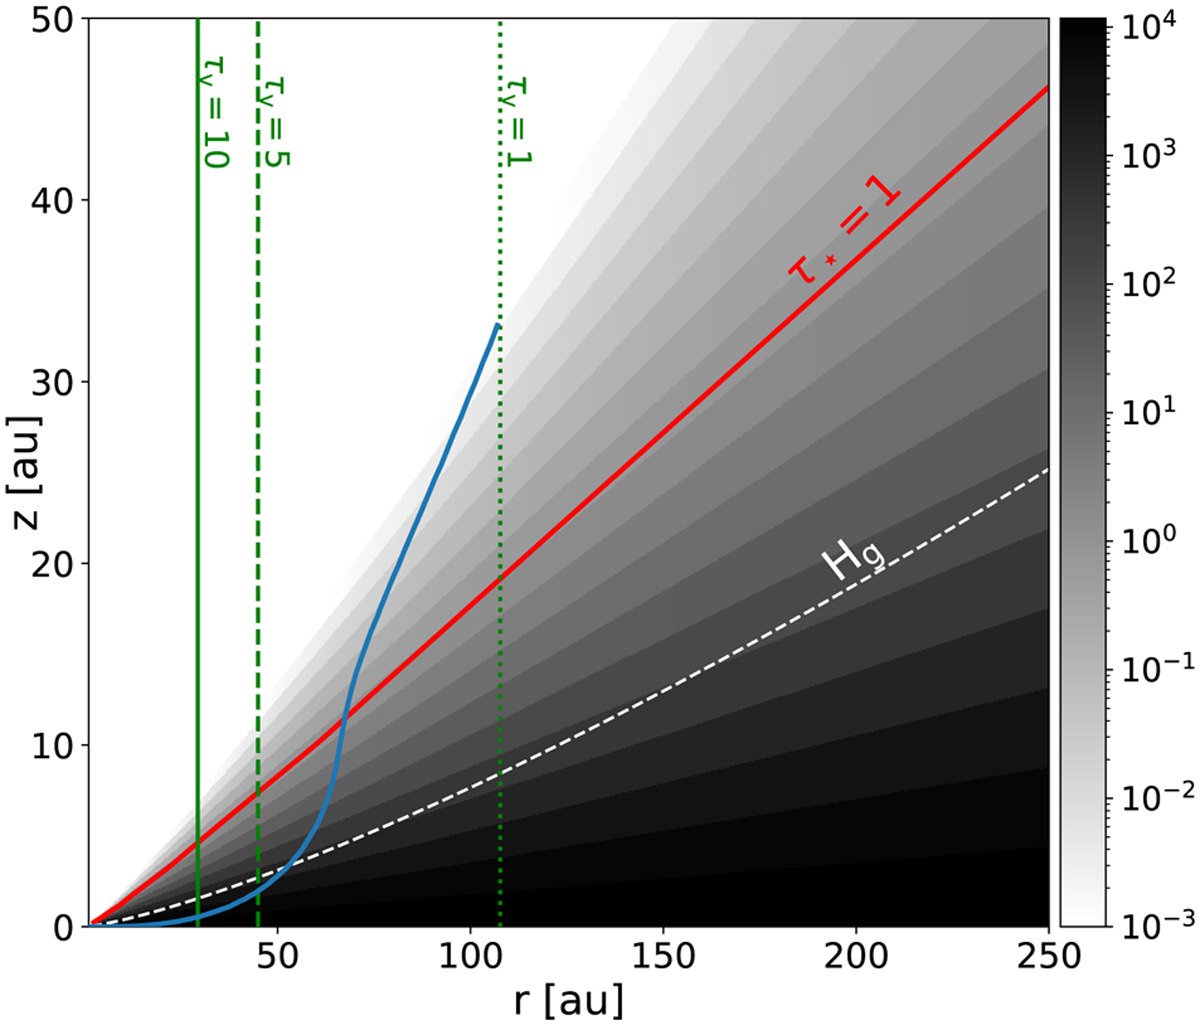
2D map of the disk. The gray scale represents the values of the optical depth computed from the star to all points in the disk τ★(r,z). The red lines represent the surface where τ★(r,z) = 1. The green lines mark the location at which the total vertical optical depth at the mid-plane becomes lower than 10, 5, and 1. The solid blue line marks the altitude at which the optical depth in the z-direction toward the upper layers becomes 1. The line diverges to infinity beyond the line τυ = 1. All opacities are given at 1 µm.
Current usage metrics show cumulative count of Article Views (full-text article views including HTML views, PDF and ePub downloads, according to the available data) and Abstracts Views on Vision4Press platform.
Data correspond to usage on the plateform after 2015. The current usage metrics is available 48-96 hours after online publication and is updated daily on week days.
Initial download of the metrics may take a while.