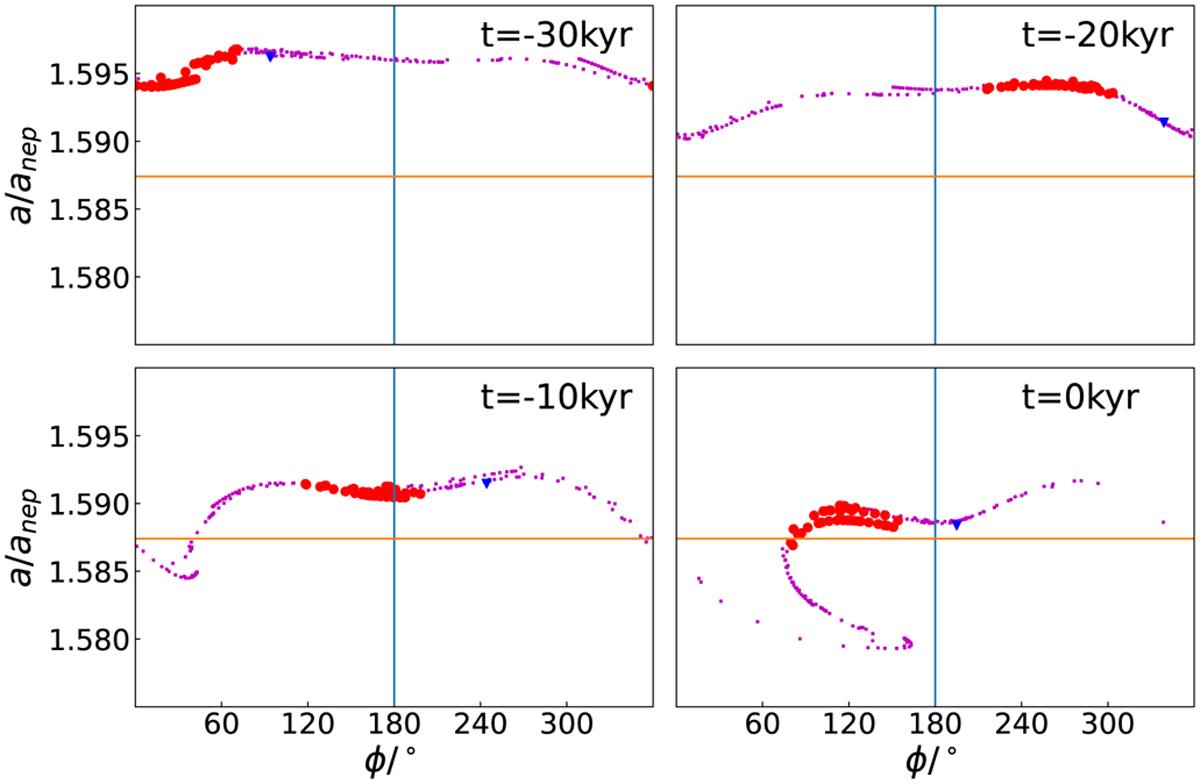
Fig. 8
Download original image
Distribution of test particles on the (ϕ, a) plane as the 1:2 resonance approaches. Four snapshots at different moments with t = 0 kyr representing exactly when the nominal resonance reaches the initial position of test particles are given in each of the four panels. Objects later captured by the leading and trailing island are in red and blue, respectively, while those not captured by any asymmetric resonance are in purple. The horizontal line stands for the nominal position of 1:2 resonance.
Current usage metrics show cumulative count of Article Views (full-text article views including HTML views, PDF and ePub downloads, according to the available data) and Abstracts Views on Vision4Press platform.
Data correspond to usage on the plateform after 2015. The current usage metrics is available 48-96 hours after online publication and is updated daily on week days.
Initial download of the metrics may take a while.