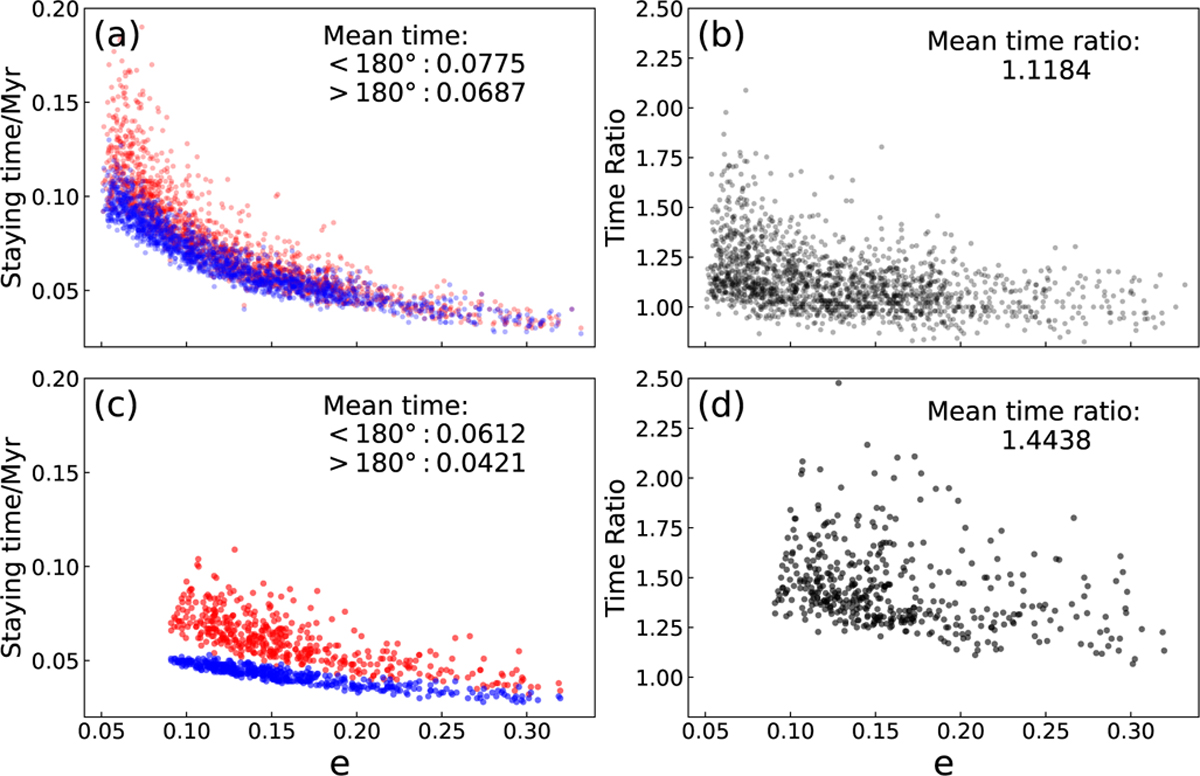
Fig. 6
Download original image
Stickiness effect of the leading island. The times an object stayed on both sides of ϕ = 180° when it was transferring from symmetric to asymmetric resonances (see text and Fig. 5) are plotted in the two left panels, and the ratio of the two time durations are shown in the right panels. The abscissa is the mean eccentricity in the last cycle before being captured by the asymmetric resonance. The red and blue dots represent the time spent in the leading and trailing side, respectively. The upper and lower panels represent the results from the simulations of migration rate: ȧN = 0.2 AU Myr−1 and ȧN = 2 AU Myr−1, respectively. In the former simulation, 1833 out of 10 000 initial objects are shown, and 435 objects for the latter are shown.
Current usage metrics show cumulative count of Article Views (full-text article views including HTML views, PDF and ePub downloads, according to the available data) and Abstracts Views on Vision4Press platform.
Data correspond to usage on the plateform after 2015. The current usage metrics is available 48-96 hours after online publication and is updated daily on week days.
Initial download of the metrics may take a while.