Fig. 5
Download original image
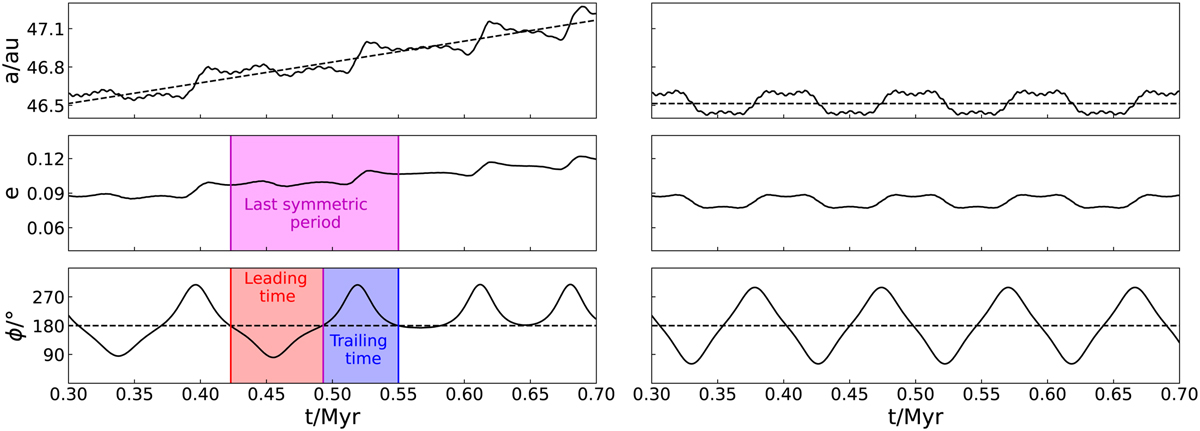
Evolution of a test particle when transferring from symmetric to asymmetric resonance. The left column is for Neptune migrating at a rate of 1 AU Myr−1, while the right column is for the same test particle but the migration stops at 0.3 Myr. From top to bottom, the panels show the semimajor axis a, eccentricity e, and resonant angle ϕ of the test particle with solid lines. The dashed lines in the top panels represent the nominal semimajor axis of the 1:2 resonance. The magenta area in the middle-left panel indicates the duration of the last symmetric cycle, while the red and blue areas in the bottom-left panel indicate the time intervals around the leading and trailing island, respectively.
Current usage metrics show cumulative count of Article Views (full-text article views including HTML views, PDF and ePub downloads, according to the available data) and Abstracts Views on Vision4Press platform.
Data correspond to usage on the plateform after 2015. The current usage metrics is available 48-96 hours after online publication and is updated daily on week days.
Initial download of the metrics may take a while.