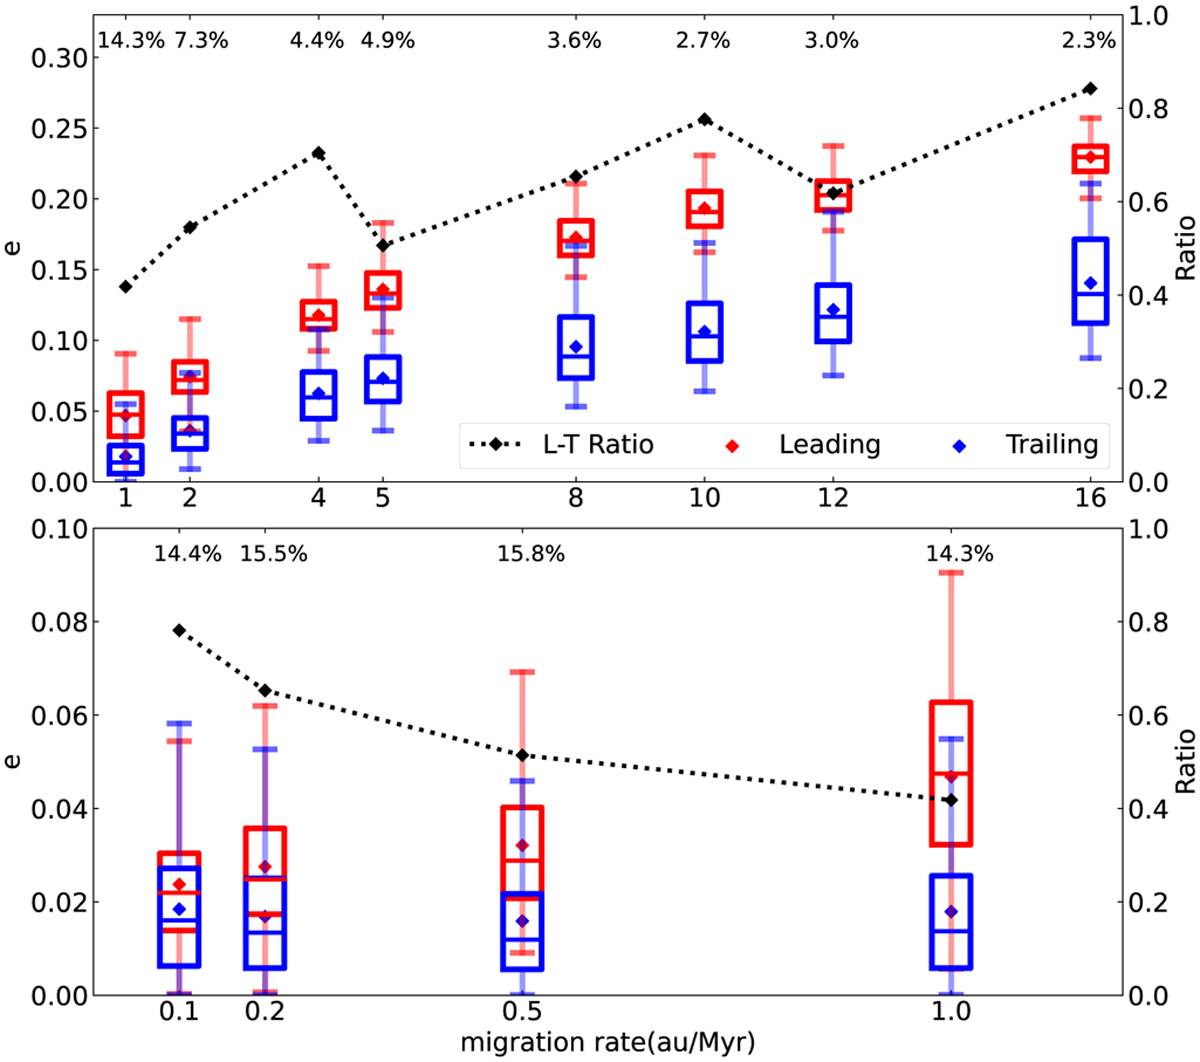
Fig. 2
Download original image
Initial eccentricities of test particles captured by the leading island (red) and trailing island (blue) at different migration rates of Neptune. The box plots indicate the minimum, maximum, median, and upper and lower quartiles as usual. The solid diamonds are the mean value of eccentricities. The L/T ratios are plotted as solid circles and are connected by a dotted line (right ordinate). The total capture efficiencies (in percent) are labelled at the top of the panels. The upper and lower panels correspond to fast and slow migration rate ranges, respectively.
Current usage metrics show cumulative count of Article Views (full-text article views including HTML views, PDF and ePub downloads, according to the available data) and Abstracts Views on Vision4Press platform.
Data correspond to usage on the plateform after 2015. The current usage metrics is available 48-96 hours after online publication and is updated daily on week days.
Initial download of the metrics may take a while.