Fig. 10
Download original image
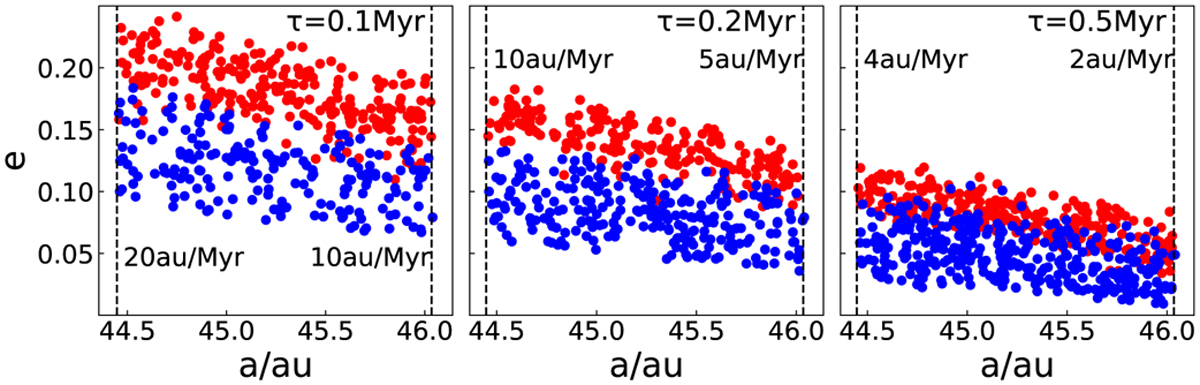
Initial semimajor axes and eccentricities of objects captured by leading (red) and trailing (blue) islands in the exponential migration model. The timescales of migration τ are marked in each panel. The vertical dashed lines are the inner and outer edge of the belt of test particles, and the numbers near them are the instant migration rates of Neptune when the nominal resonance arrives at both edges of the planetesimals’ belt.
Current usage metrics show cumulative count of Article Views (full-text article views including HTML views, PDF and ePub downloads, according to the available data) and Abstracts Views on Vision4Press platform.
Data correspond to usage on the plateform after 2015. The current usage metrics is available 48-96 hours after online publication and is updated daily on week days.
Initial download of the metrics may take a while.