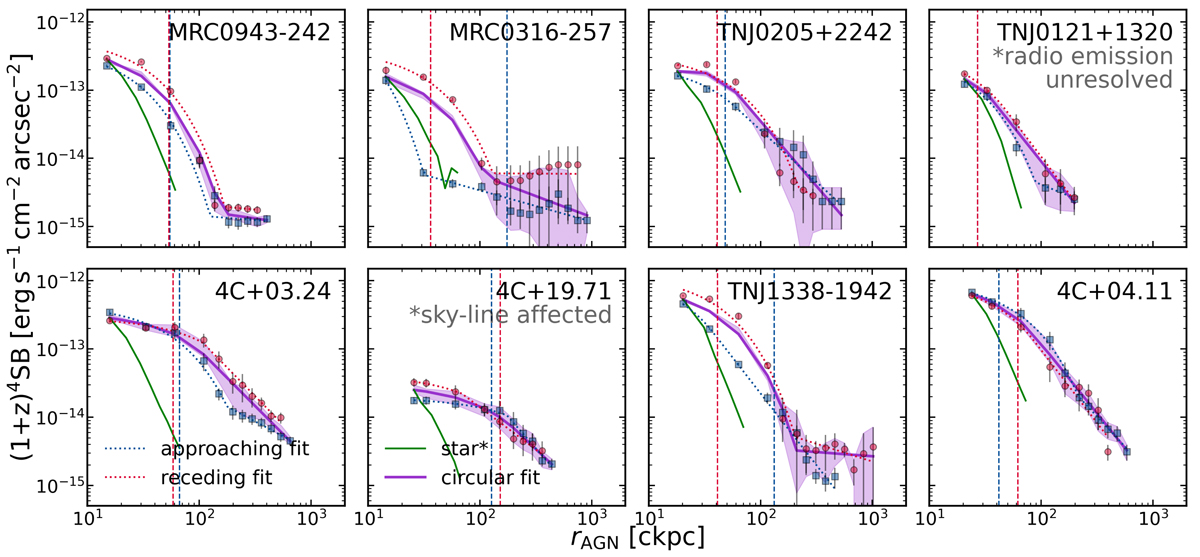
Fig. 6.
Download original image
Surface brightness radial profiles for approaching (blue squares) and receding (red circles) directions along the jet axis. The dotted curves in corresponding colours show the exponential+power law fits for the two directional profiles. We also include the fits for the circularly averaged profile in solid magenta lines. In each panel, the magenta shaded region mark again the same uncertainty range for the intrinsic surface brightness profile as Fig. 5. The solid green curve is the normalised radial profile of a star extracted up to 2″ (the one in the FoV of MRC0316-257 is extracted from a round galaxy due to no available star) showing the PSF (Table 1). The vertical dashed lines indicate the distances of the jet hot spots in corresponding colours. The profile along the receding side of the jet is brighter than along approaching side for most sources within the extent of the jets except 4C+03.24 and 4C+04.11. This may indicate different gas density distribution (see Sect. 4.2.2). We also identify flatting of the profile at ≳100 ckpc for MRC0943-242, MRC0316-257 and TNJ1338-1942 which may related to nearby companions (see Sect. 5.4).
Current usage metrics show cumulative count of Article Views (full-text article views including HTML views, PDF and ePub downloads, according to the available data) and Abstracts Views on Vision4Press platform.
Data correspond to usage on the plateform after 2015. The current usage metrics is available 48-96 hours after online publication and is updated daily on week days.
Initial download of the metrics may take a while.