Fig. 5.
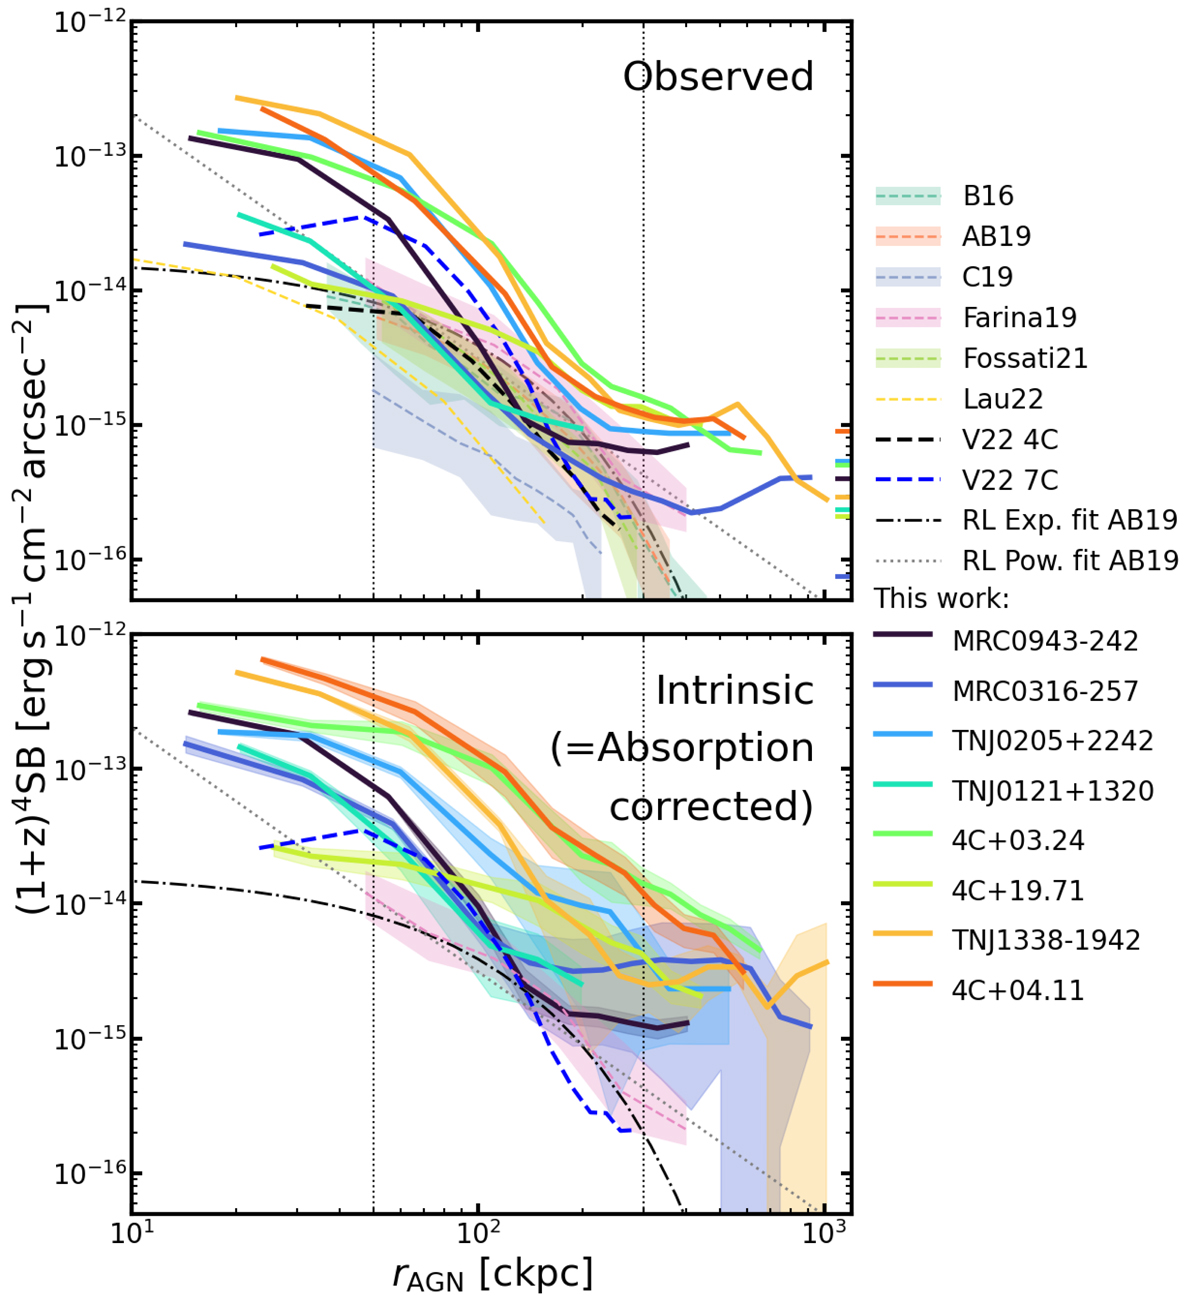
Download original image
Radial profiles of the Lyα nebulae extracted in circular annuli (Fig. D.1). For better comparison, we show the radial profile in comoving kpc (ckpc) and take the cosmological dimming into account by a factor of (1 + z)4, where z is the redshift of the target. The black dot-dashed curve and grey dotted line in both panels are the best fitted exponential and power law profiles of the Arrigoni Battaia et al. (2019) radio loud sample, respectively. The two vertical dotted lines mark the 50 and 300 ckpc, respectively. Upper panel: Radial profile of observed surface brightness map in thicker solid lines. In this panel, we also include the radial profiles of other quasar samples (dashed lines) for comparison: B16 – Borisova et al. (2016), AB19 – Arrigoni Battaia et al. (2019), C19 – Cai et al. (2019), Farina19 – Farina et al. (2019), Fossati21 – Fossati et al. (2021), L22 – Lau et al. (2022) and V22 – Vayner et al. (2023; two sources, 4C09.17 and 7C 1354+2552). When it is available, we show the range spanned by the 25th and 75th of the comparison sample radial profile as the shaded region around median profile in the same colour. The horizontal bars at the right-most indicate the observed surface brightness limits (scaled by area from Table 2) for each target in the same colour. Lower panel: Intrinsic radial profile in thicker solid lines. The shaded regions around each profiles indicates the uncertainty range of the surface brightness from fitting. In this panel, we show again the same profiles of F19 and V22 7C as in the upper panel for comparison. Our HzRGs are extended further with higher surface brightnesses (or flattening in some sources) at larger radii (∼300 ckpc) compared to other samples.
Current usage metrics show cumulative count of Article Views (full-text article views including HTML views, PDF and ePub downloads, according to the available data) and Abstracts Views on Vision4Press platform.
Data correspond to usage on the plateform after 2015. The current usage metrics is available 48-96 hours after online publication and is updated daily on week days.
Initial download of the metrics may take a while.