Fig. E.1.
Download original image
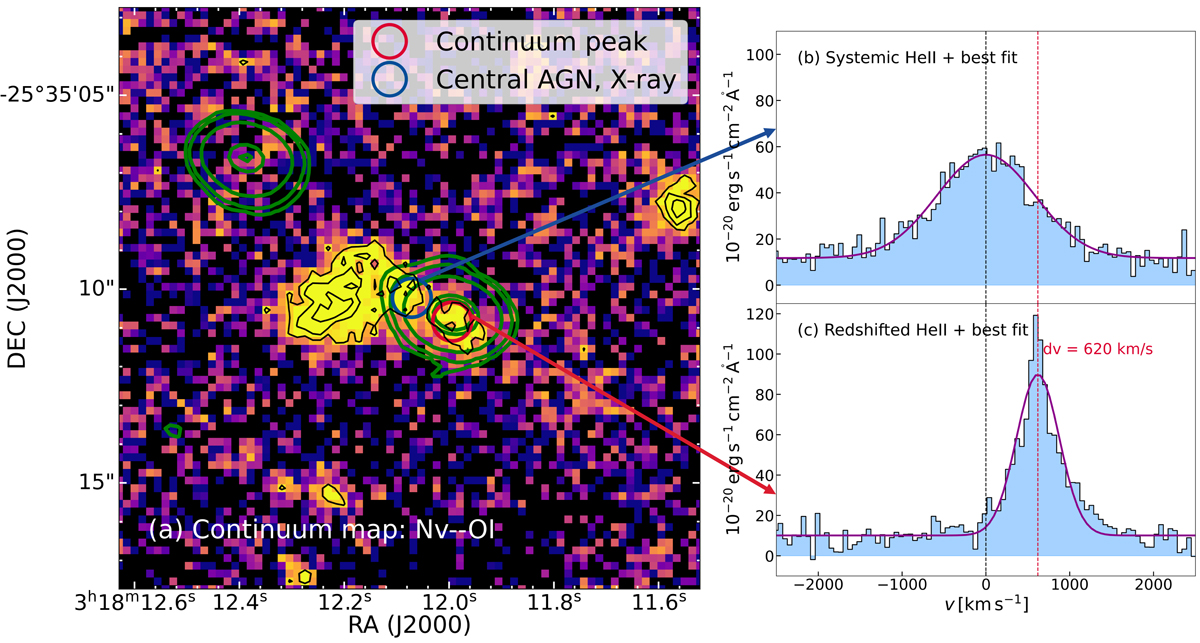
UV continuum map around MRC0316-257 (a) and He II spectra from the X-ray position (central AGN, b) and UV continuum peak position (c). The UV continuum map is collapsed between the observed wavelength of N Vλ1240 and O I+Si IIλ1305. The green contours show the radio jet in the same format as Fig. 1cd. The black contours in the step of [3σ, 5σ, 7σ, ...] trace the UV continuum emission, where σ is the background standard deviation. Blue and red circular regions indicate the r = 0.5 arcsec apertures where the systemic and redshifted He II spectra are extract, respectively. The right panels (b, c) show the He II spectra (histogram) along with their best Gaussian fitting (dark magenta line) results. The velocity zero (vertical black dotted line) in both panels is the systemic redshift. In the panel(c), we also mark the velocity shift (vertical red dotted line) of the redshifted He II emission with respect to the systemic one.
Current usage metrics show cumulative count of Article Views (full-text article views including HTML views, PDF and ePub downloads, according to the available data) and Abstracts Views on Vision4Press platform.
Data correspond to usage on the plateform after 2015. The current usage metrics is available 48-96 hours after online publication and is updated daily on week days.
Initial download of the metrics may take a while.