Fig. D.2.
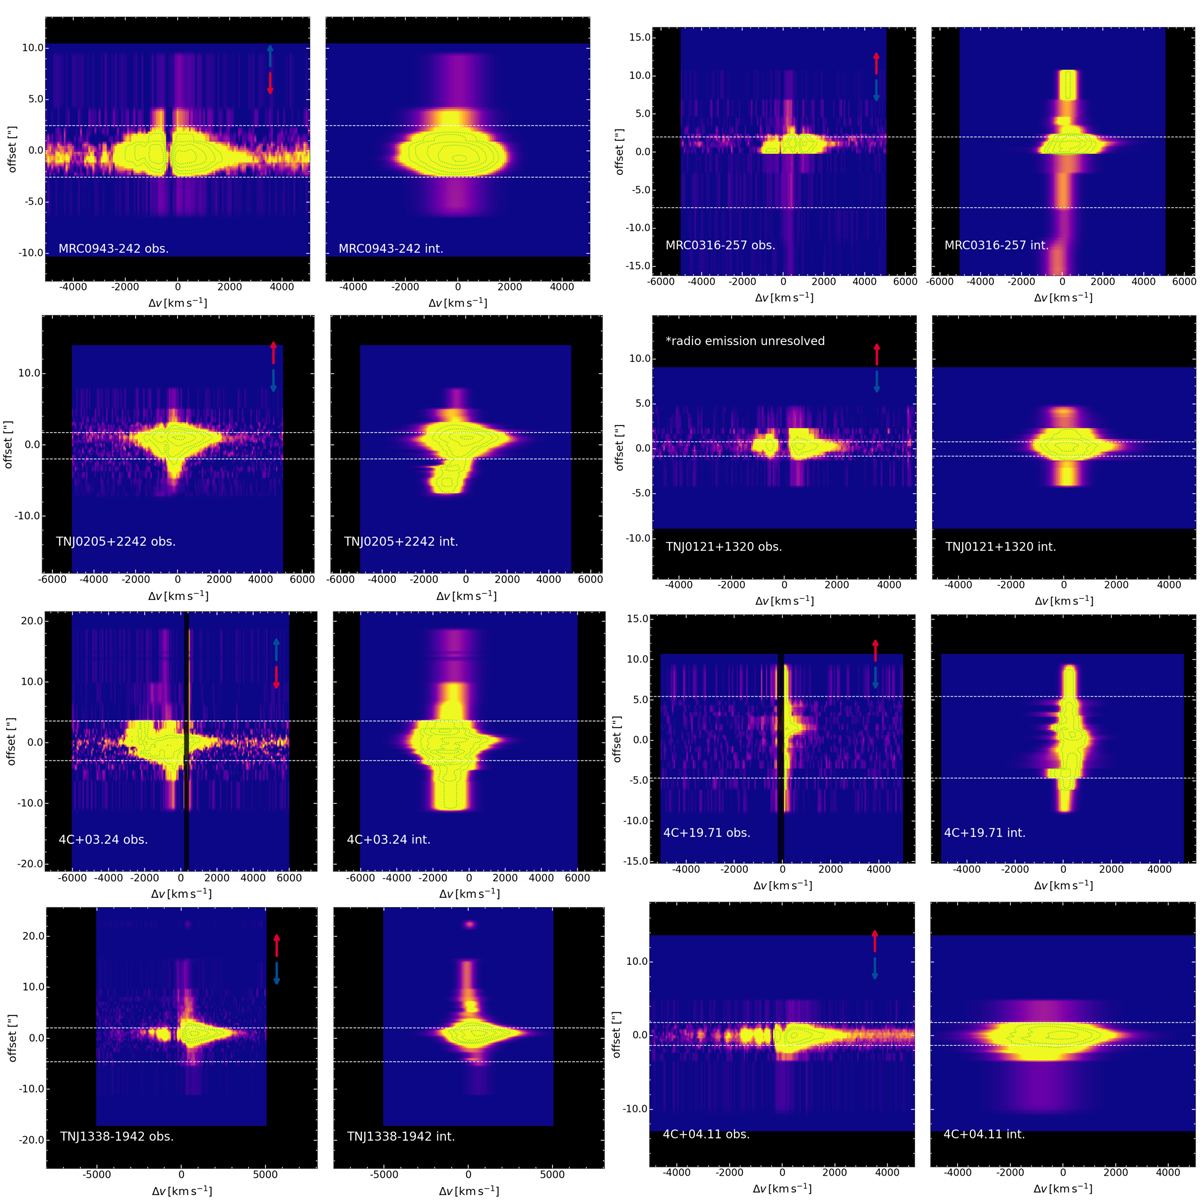
Download original image
Lyα position-velocity diagrams (i.e. 2D spectra) of our sample targets extracted along the radio jet axis. For each target, the left panel shows the diagram constructed from tessellated observed cube (not continuum-subtracted for the host galaxy) and the right panel shows the diagram from absorption-corrected intrinsic cube. The zero offset is set to the position of the central AGN (Table 2). The direction of approaching and receding sides of the jet (see Sect. 2.1.3) are marked in the left panel by the blue and red arrows, respectively. The white horizontal dashed lines represent the furthest extent of the jet. The dotted green contours are given in arbitrary steps which are used to guide the eye for the high brightness part. The vertical black shaded regions in the observed position-velocity diagrams of 4C+03.24 and 4C+19.71 indicate the wavelength ranges affected by the 5577 Å sky-line.
Current usage metrics show cumulative count of Article Views (full-text article views including HTML views, PDF and ePub downloads, according to the available data) and Abstracts Views on Vision4Press platform.
Data correspond to usage on the plateform after 2015. The current usage metrics is available 48-96 hours after online publication and is updated daily on week days.
Initial download of the metrics may take a while.