Fig. 2.
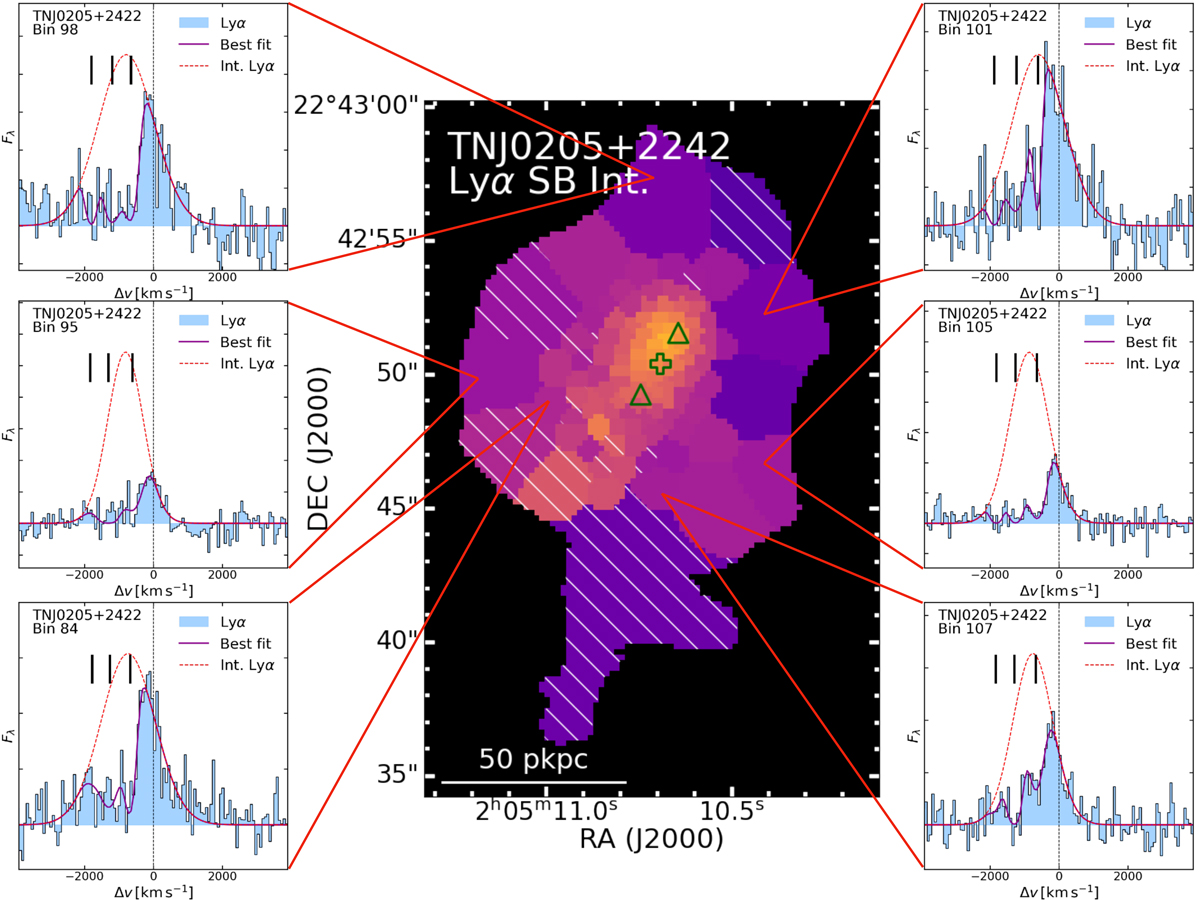
Download original image
Example for the intrinsic mapping of the Lyα nebula of TNJ0205+2242. The central panel shows the intrinsic surface brightness map of TNJ0205+2242 which is the same as Fig. 1b. The green cross and triangles mark the position of the AGN and jet lobes, respectively. In each of the side panel, we show the spectrum (blue shade histogram in normalised flux unit) extracted from the individual spatial bin whose number is labelled at the top left, and the best fit (dark magenta curve) and recovered intrinsic Lyα (dashed red line). The black vertical bars indicate the positions of the H I absorbers.
Current usage metrics show cumulative count of Article Views (full-text article views including HTML views, PDF and ePub downloads, according to the available data) and Abstracts Views on Vision4Press platform.
Data correspond to usage on the plateform after 2015. The current usage metrics is available 48-96 hours after online publication and is updated daily on week days.
Initial download of the metrics may take a while.