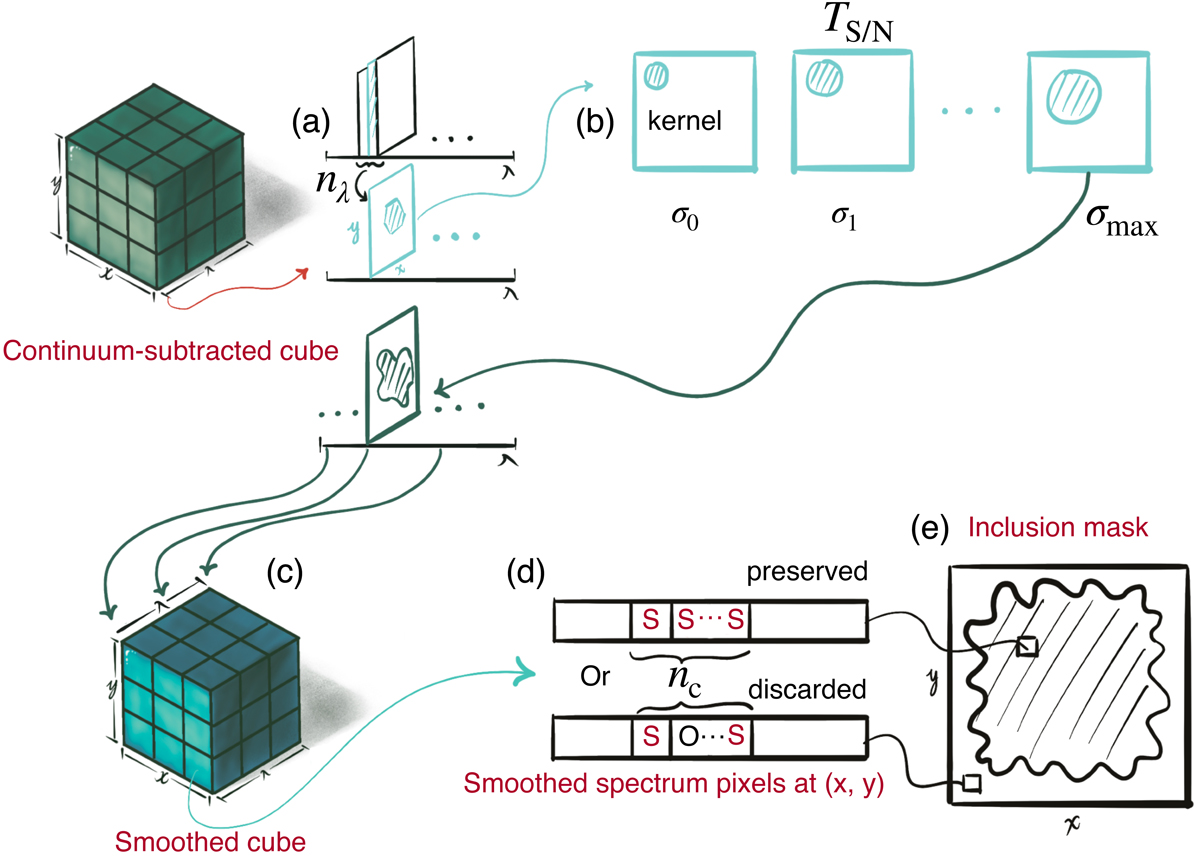
Fig. A.1.
Download original image
Schematic presentation of the detection map construction. (a) Average nλ number of images around each of the image slices (cyan) from the continuum-subtracted cube (dark green cube). (b) Spatially smooth each of the averaged image with Gaussian kernel. The algorithm will increase the kernel size (σ0 < σ1) to smooth the spaxels that not passing the TS/N, S/N threshold, at each steps until the maximum, σmax, has been reached. (c) Combine the adaptively smoothed images into the smoothed cube (lighter green cube). (d) Check the smoothed spectrum (long black rectangular box) at location (x, y). The position is preserved when there are nc consecutive number of pixels selected with signal detection (red ’S’) in previous steps. (f) Construct the detection map.
Current usage metrics show cumulative count of Article Views (full-text article views including HTML views, PDF and ePub downloads, according to the available data) and Abstracts Views on Vision4Press platform.
Data correspond to usage on the plateform after 2015. The current usage metrics is available 48-96 hours after online publication and is updated daily on week days.
Initial download of the metrics may take a while.