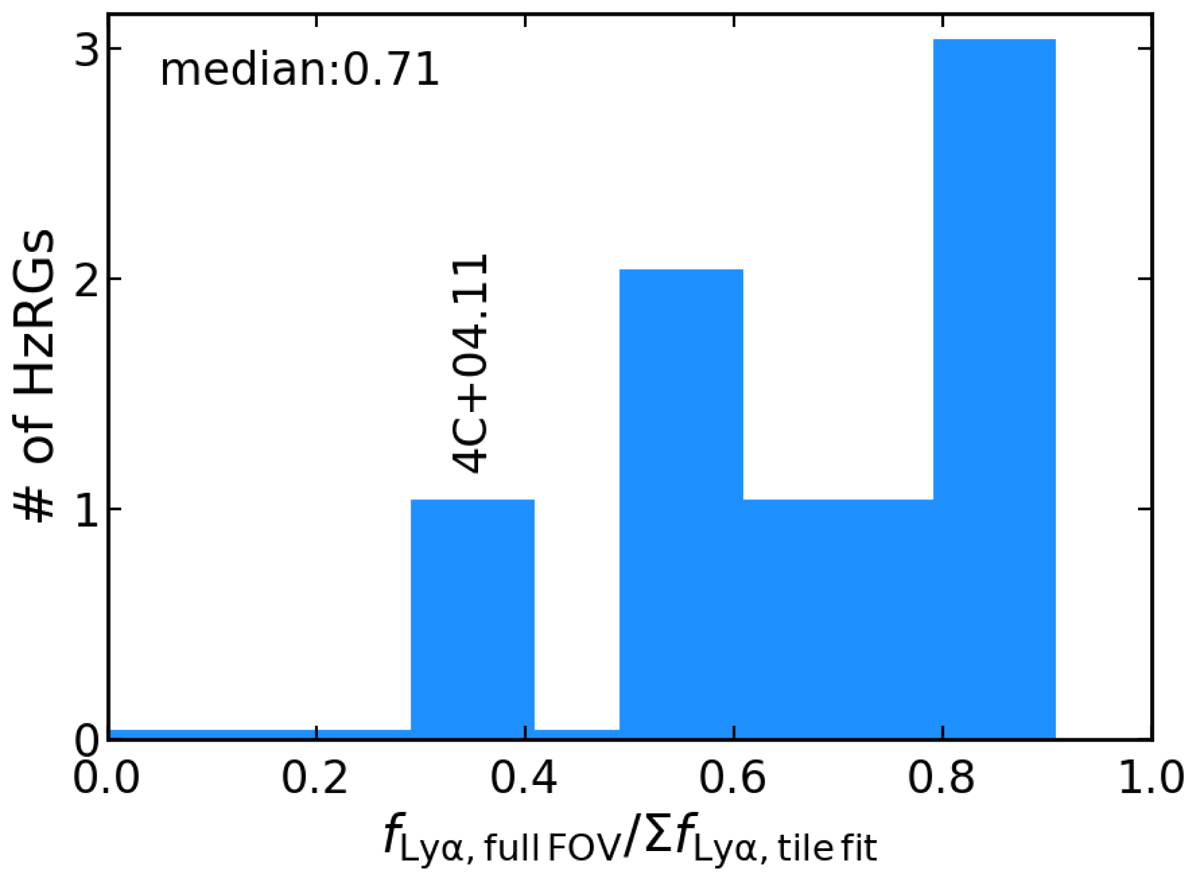
Fig. 12.

Download original image
Distribution of the angle difference between nebular position angle and radio jet position angle, |θ − PAradio|. The blue histogram shows the number distribution of flux-weighted angle difference, |θweight − PAradio| (sensitive to high surface brightness nebula morphology). The magenta histogram represents the unweighted measurements, |θunweight − PAradio| (quantifying the morphology of the whole nebula). The values are presented in Table 3. We mark the obvious outliers in the two distributions in corresponding colours. This shows that most of our HzRGs have their Lyα nebula elongated along the jet axis.
Current usage metrics show cumulative count of Article Views (full-text article views including HTML views, PDF and ePub downloads, according to the available data) and Abstracts Views on Vision4Press platform.
Data correspond to usage on the plateform after 2015. The current usage metrics is available 48-96 hours after online publication and is updated daily on week days.
Initial download of the metrics may take a while.


