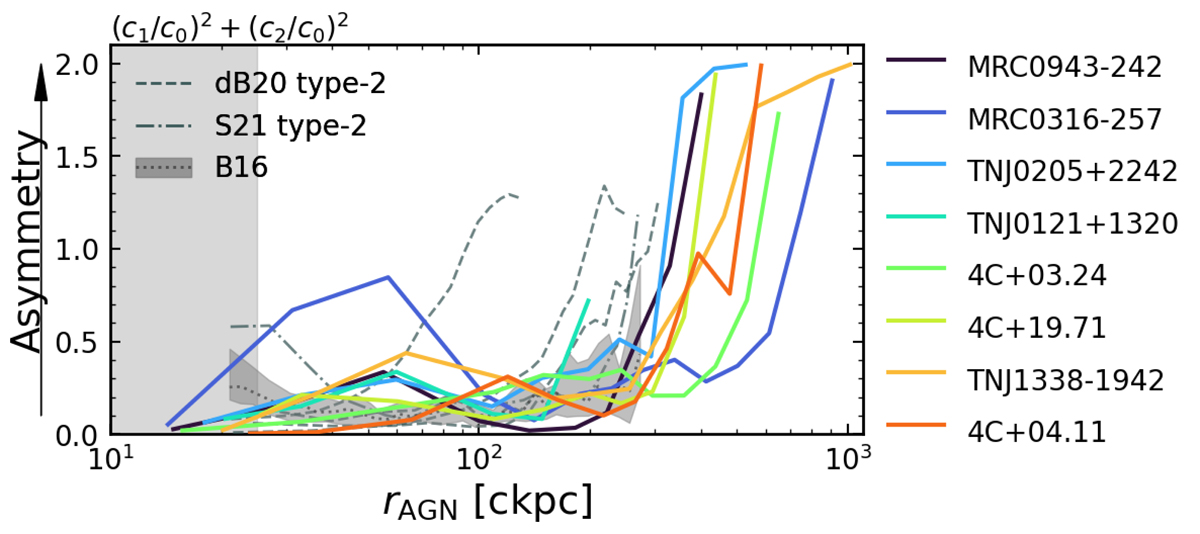
Fig. 10.
Download original image
Radial profiles of the surface brightness Fourier decomposition (asymmetry measurement). The c0, c1 and c2 are the 0th, 1st and 2nd modes Fourier decomposition coefficients of the surface brightness radial profile, respectively (see den Brok et al. 2020, for definition). The (c1/c0)2 + (c2/c0)2 is a measurement of nebula asymmetry along the radial distance from the AGN. Our HzRGs are shown in solid colour lines. rAGN is the radial distance measured from the central AGN. For comparison, we include the same measurements for the 4 nebulae of type-2 quasars from den Brok et al. (2020; grey dashed lines) and the type-2 from Sanderson et al. (2021; grey dot-dashed line). We also include the type-1 measurements from Borisova et al. (2016; dotted line represents the median and shaded region marks the 25th and 75th percentile, quantified by den Brok et al. 2020). The vertical shaded region is the 0.75 arcsec (∼25 ckpc) range affected by median seeing of our sample (the radial distance where the type-1 PSF is affected is ∼50 ckpc, see den Brok et al. 2020). The morphologies for most of the HzRGs nebulae are round (symmetric) ≲100 ckpc and become asymmetric at larger radial distances ∼100 ckpc (see text).
Current usage metrics show cumulative count of Article Views (full-text article views including HTML views, PDF and ePub downloads, according to the available data) and Abstracts Views on Vision4Press platform.
Data correspond to usage on the plateform after 2015. The current usage metrics is available 48-96 hours after online publication and is updated daily on week days.
Initial download of the metrics may take a while.