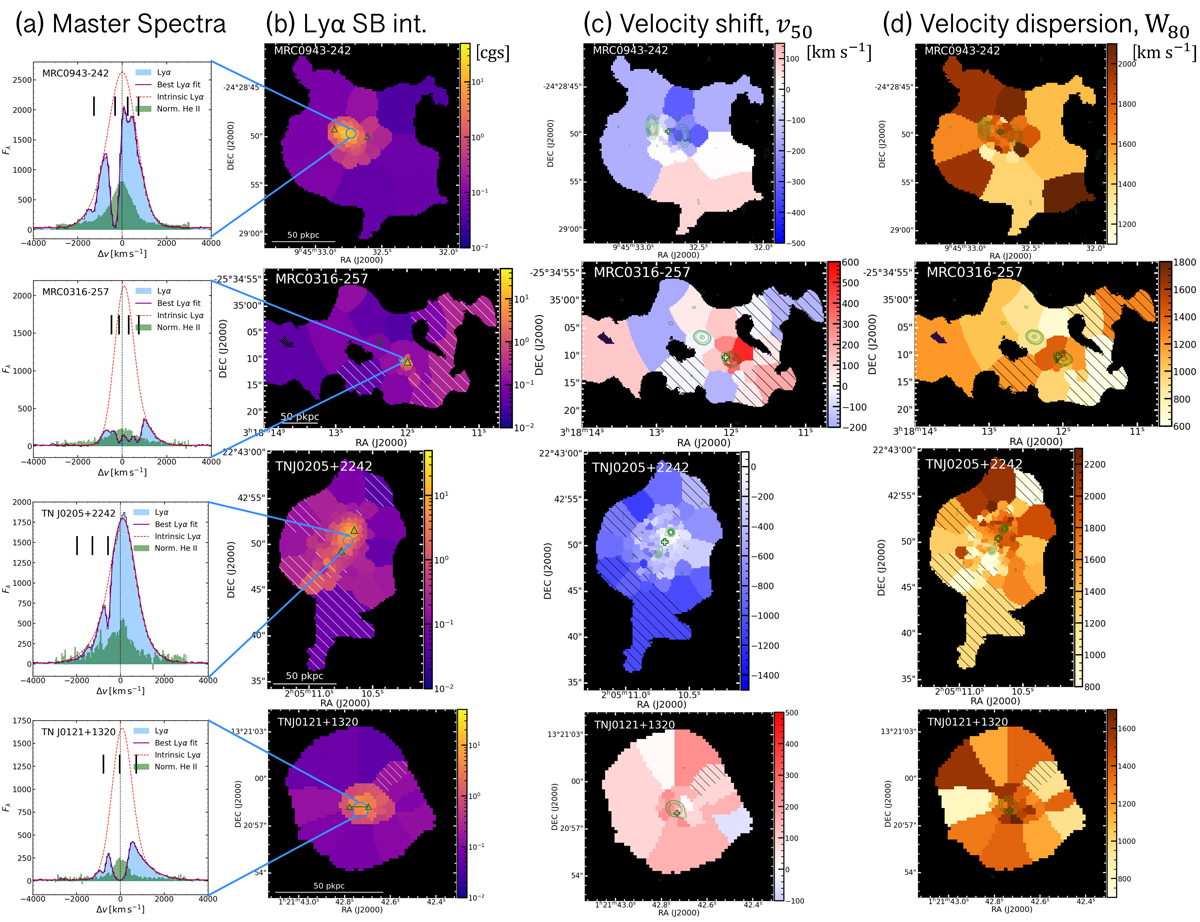
Fig. 1.
Download original image
Mapping results of our MUSE HzRGs sample. (a) Master Lyα spectrum (blue shaded histogram) extracted from a r = 0.5 arcsec aperture at the AGN position with best fit (solid dark magenta line). Red dashed curve shows the intrinsic Lyα from fitting, i.e. corrected for absorption. The vertical black bars above the emission line mark the positions of the H I absorbers. The yellow shaded region (if any) indicates the 5 wavelength pixel range excluded in the fitting due to the contamination from the 5577 Å sky-line. The flux density unit, Fλ, is 10−20 erg s−1 cm−2 Å−1. We also show the scaled He IIλ1640 Å spectrum extracted from the same position in green histogram. We scale the peak flux density of He II to 0.3 − 0.7 (varied for different targets) of the maximum peak flux density of observed Lyα spectrum in −1000 to 1000 km s−1. The Δv = 0 km s−1 is the systemic redshift based on He II or [C I] (Table 1, Kolwa et al. 2023). (b) Intrinsic Lyα surface brightness map. The flux in each tile is the integrated flux of the line emission corrected for absorption, i.e. total flux of the one or two Gaussians, see Sect. 3.2. The light blue circle shows the aperture where the Master spectrum is extracted from. Green triangles mark the positions of the radio lobes. We place a green bar linking the triangles on TN J0121+1320 to indicate the unresolved state of its radio emission. The length of the bar represents the linear size of the 3σ contour along the east-west direction. The white hatched regions are the ones where the flux uncertainty is higher than 50% of the fitted intrinsic flux. The white bar indicates the 50 pkpc at the redshift of the radio galaxy. The unit of the surface brightness is 10−16 erg s−1 cm−2 arcsec−2. We apply the same colour scale for all targets. (c) v50 map of the intrinsic Lyα nebula. The zero velocity used for each target is determined by the systemic redshift (Table 1). Green contours show the morphology of the radio jet in arbitrary values. The green cross mark the AGN position (Table 2). (d) W80 map of the intrinsic Lyα nebula. The black hatched regions on (c, d) are the same as (b). The purple hatched regions (in 4C+03.24 and TN J1338-1942) are manually excluded due to contamination from either foreground star or known companion (Arrow galaxy in the filed of MRC0316-257, see Vernet et al. 2017). We note that the colour scales for panels c and d are customised. The purple hatched area (if any) indicates the manually excluded region affected by foreground star or known Lyα emitter.
Current usage metrics show cumulative count of Article Views (full-text article views including HTML views, PDF and ePub downloads, according to the available data) and Abstracts Views on Vision4Press platform.
Data correspond to usage on the plateform after 2015. The current usage metrics is available 48-96 hours after online publication and is updated daily on week days.
Initial download of the metrics may take a while.