Fig. 9.

Download original image
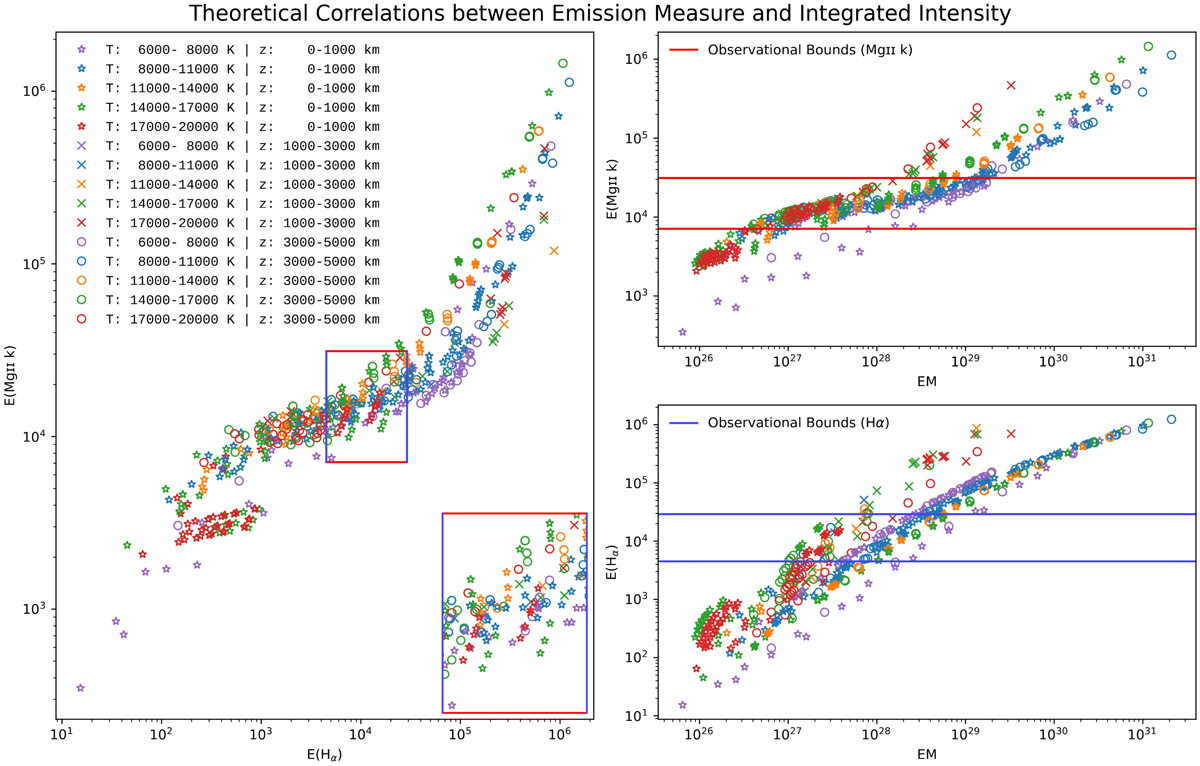
Theoretical correlations between emission measure and integrated intensity. Left: relationship between the integrated intensity of Mg II k and the integrated intensity of Hα derived from the theoretical models computed with a micro-turbulence equal to 5 km s−1 and for different values of temperature and slab thickness. Top right: integrated Mg II k intensity versus EM. Bottom right: integrated Hα intensity versus EM. The horizontal (vertical) lines limit the range of Mg II k (Hα) intensities. Integrated intensities are in erg s−1 cm−2 sr−1 and EM are in cm−5. The small slab thickness models (stars) are new models. They fit quite well in the box of the observations.
Current usage metrics show cumulative count of Article Views (full-text article views including HTML views, PDF and ePub downloads, according to the available data) and Abstracts Views on Vision4Press platform.
Data correspond to usage on the plateform after 2015. The current usage metrics is available 48-96 hours after online publication and is updated daily on week days.
Initial download of the metrics may take a while.


