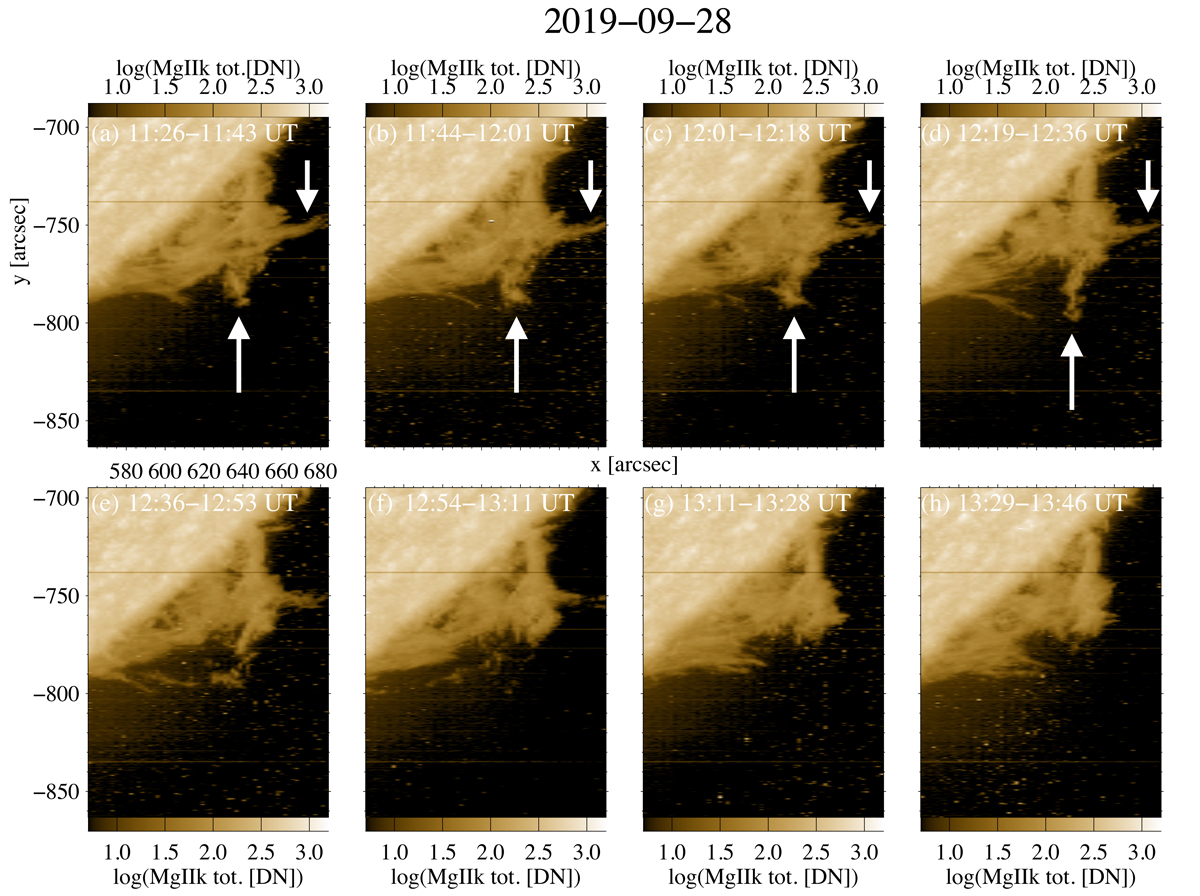
Fig. 4.

Download original image
Evolution of the Mg II k integrated intensity maps from 11:26 UT to 13:46 UT (rasters 1–8). Each map corresponds to a raster of the prominence obtained in the field of view (127 arcsec × 175 arcsec) indicated in Fig. 2 by two vertical dashed lines. The time needed to raster the prominence is indicated at the top of the image (around 16.5 min). The maps are reconstructed by using the 64 Mg II k slit spectra of the raster scan and integrating the intensity in a wavelength range of ±2 Å around the Mg II peak intensity. Two horns are visible at the top of the prominence in the first five maps; white arrows point to the horn’s location.
Current usage metrics show cumulative count of Article Views (full-text article views including HTML views, PDF and ePub downloads, according to the available data) and Abstracts Views on Vision4Press platform.
Data correspond to usage on the plateform after 2015. The current usage metrics is available 48-96 hours after online publication and is updated daily on week days.
Initial download of the metrics may take a while.


