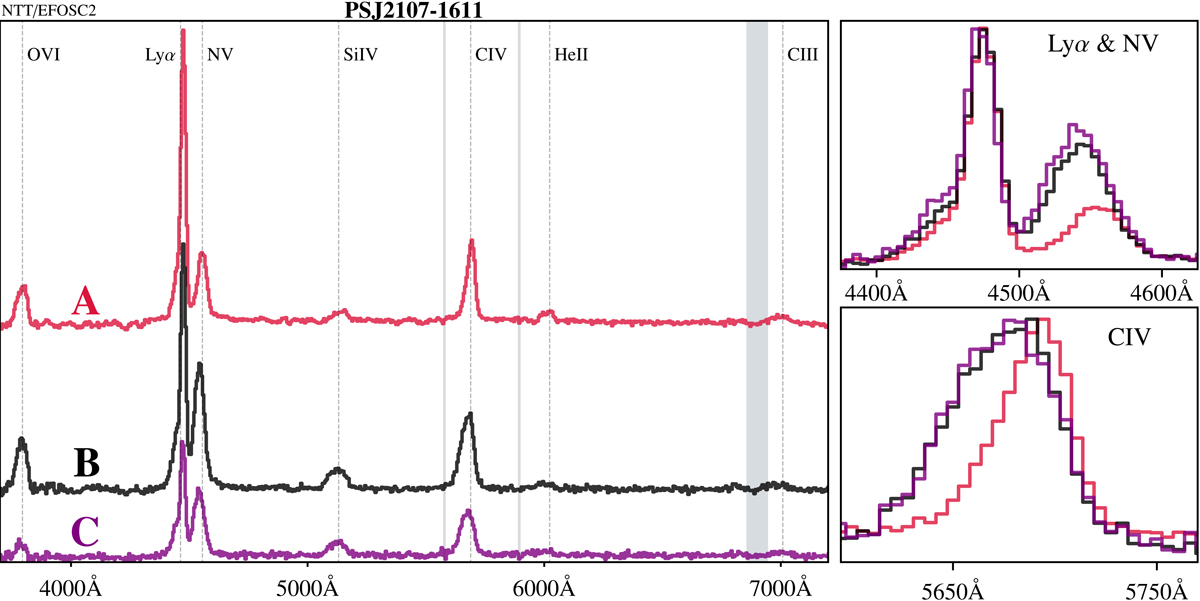
Fig. 2.
Download original image
EFOSC2 spectra of the three visible lensed images of PS J2107−1611. The A spectrum is the average of the individual spectra extracted from the two slit angles shown in Fig. 1. Left: complete spectra with fluxes shifted for display purposes. Right: zoom-ins on the Lyα, N V and C IV emission lines. The zoomed-in regions are normalized to their maximum intensity to highlight the larger skewness in these two lines of the A spectrum.
Current usage metrics show cumulative count of Article Views (full-text article views including HTML views, PDF and ePub downloads, according to the available data) and Abstracts Views on Vision4Press platform.
Data correspond to usage on the plateform after 2015. The current usage metrics is available 48-96 hours after online publication and is updated daily on week days.
Initial download of the metrics may take a while.