Fig. 4
Download original image
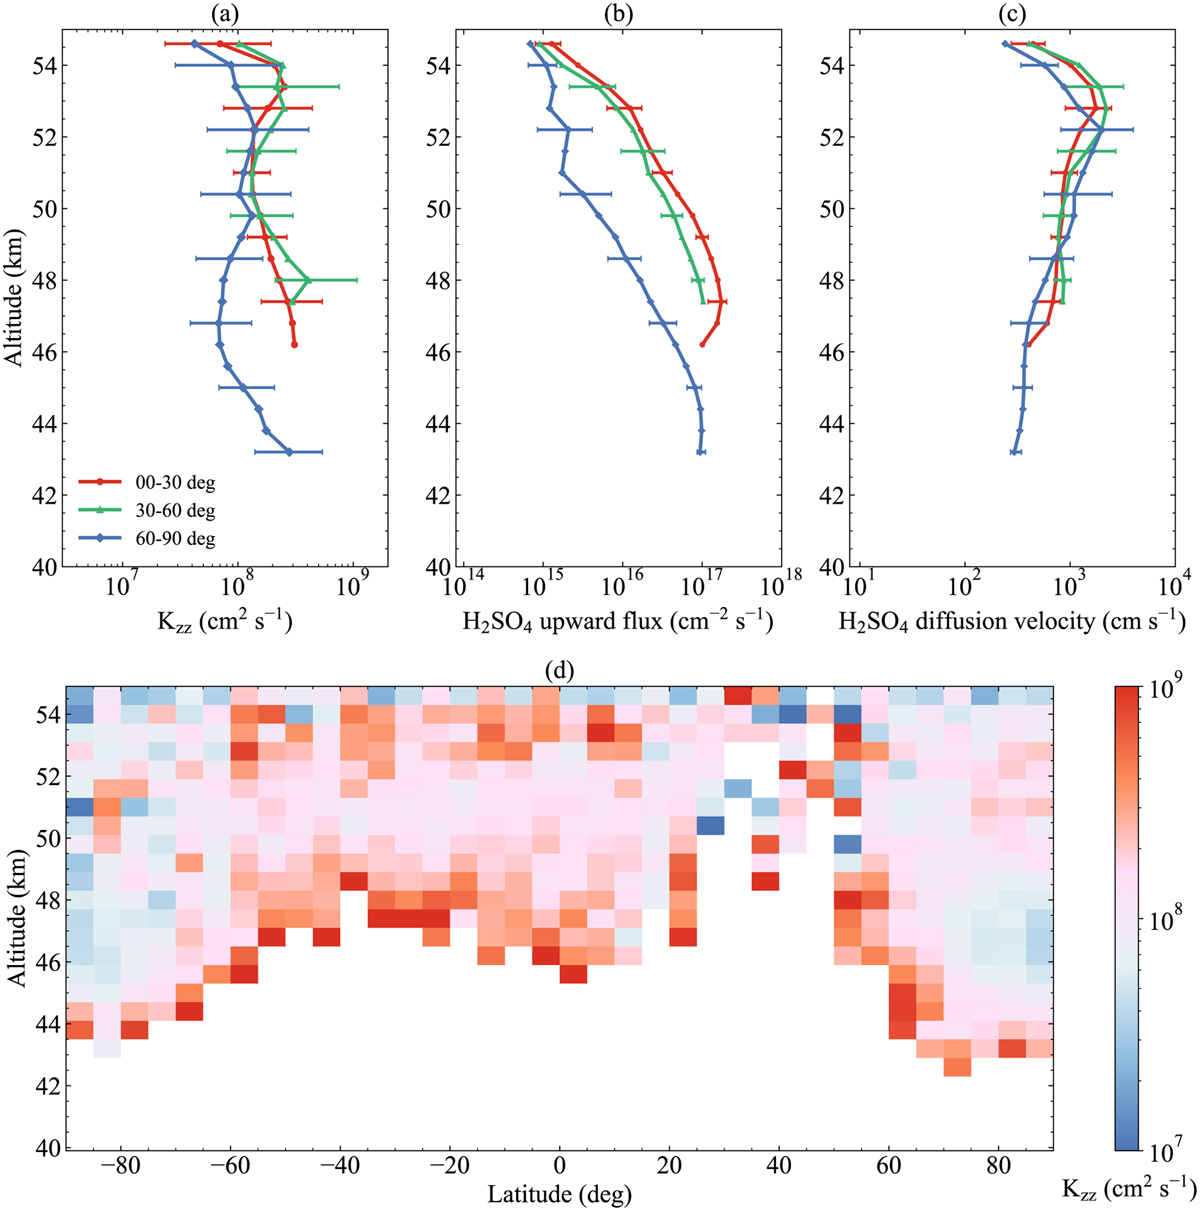
Latitudinal variation. (a) Kzz, (b) H2SO4 vapor upward diffusion flux, and (c) H2SO4 vapor eddy diffusion velocity profiles in different latitude bins were derived by adopting particle distributions from the microphysical model results (McGouldrick & Barth 2023). The red, green, and blue lines represent the latitudinal bins of 0°–30°, 30°–60°, and 60°–90°, respectively. Panel d presents the altitude-latitude distribution of derived Kzz. We note that the missing middle-latitude results near 47 km are caused by a lack of data.
Current usage metrics show cumulative count of Article Views (full-text article views including HTML views, PDF and ePub downloads, according to the available data) and Abstracts Views on Vision4Press platform.
Data correspond to usage on the plateform after 2015. The current usage metrics is available 48-96 hours after online publication and is updated daily on week days.
Initial download of the metrics may take a while.