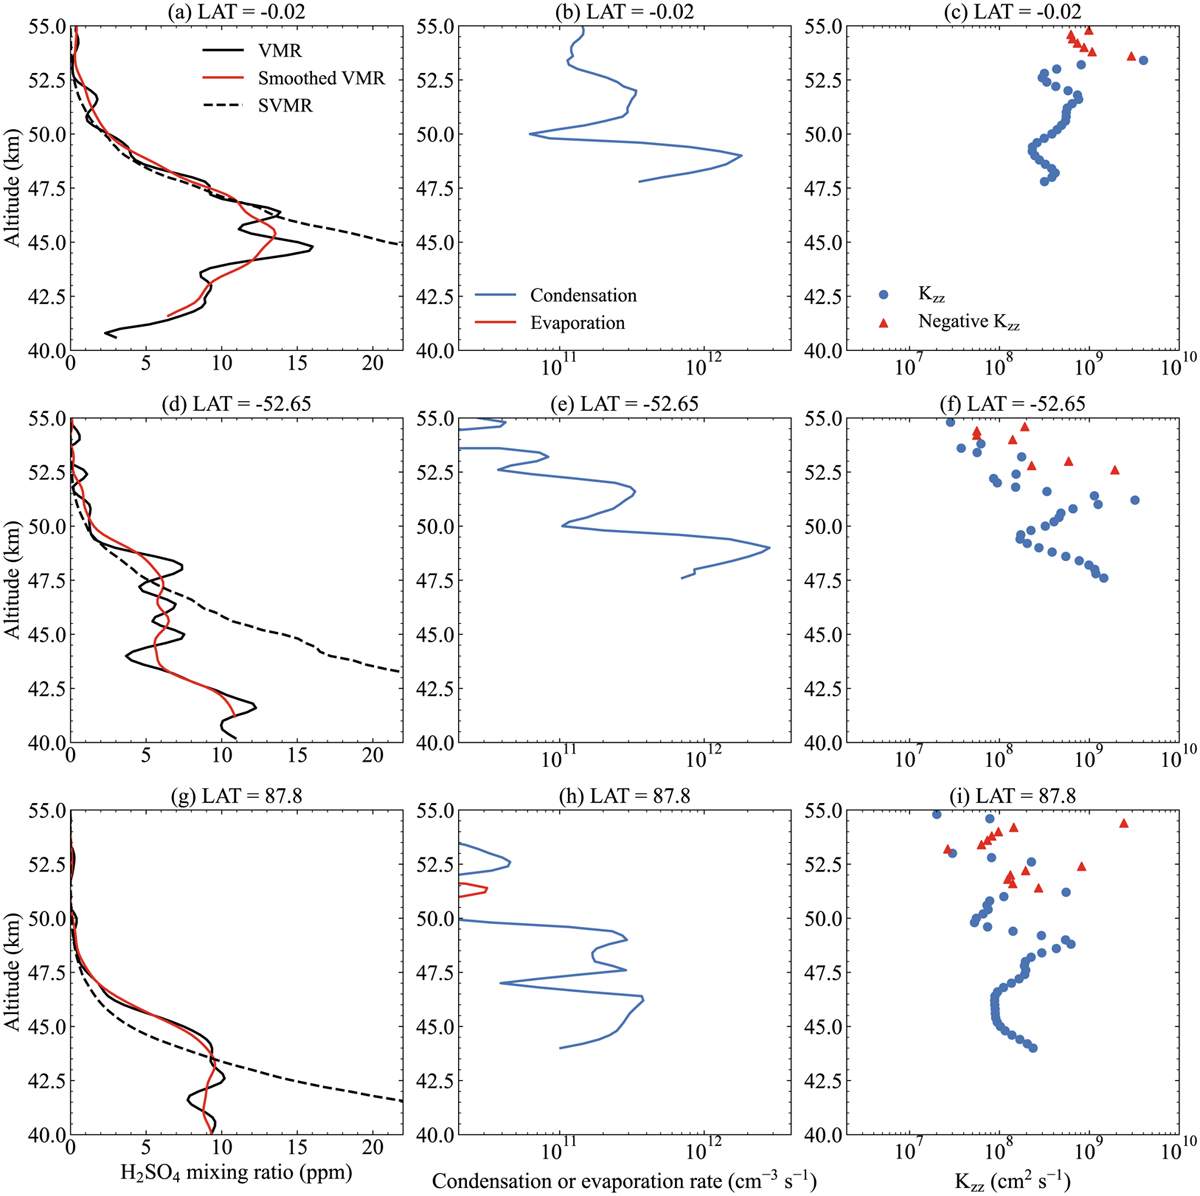
Fig. 2
Download original image
Example cases illustrating the method of Kzz estimation. The three rows refer to (a–c) −0.02°, (d–f) −52.65°, and (g–i) 87.8° latitude, respectively. The left column shows the original H2SO4 vapor mixing ratio (VMR, solid black line), smoothed H2SO4 vapor mixing ratio (solid red line), and saturation vapor mixing ratio (SVMR, dashed black line) profiles. The middle column shows the net condensation (blue line) and evaporation (red line) rate profiles. The right column shows the derived Kzz distributions. The red triangles represent negative values, caused by the statistical fluctuation and horizontal convergence or divergence of H2SO4 vapor.
Current usage metrics show cumulative count of Article Views (full-text article views including HTML views, PDF and ePub downloads, according to the available data) and Abstracts Views on Vision4Press platform.
Data correspond to usage on the plateform after 2015. The current usage metrics is available 48-96 hours after online publication and is updated daily on week days.
Initial download of the metrics may take a while.