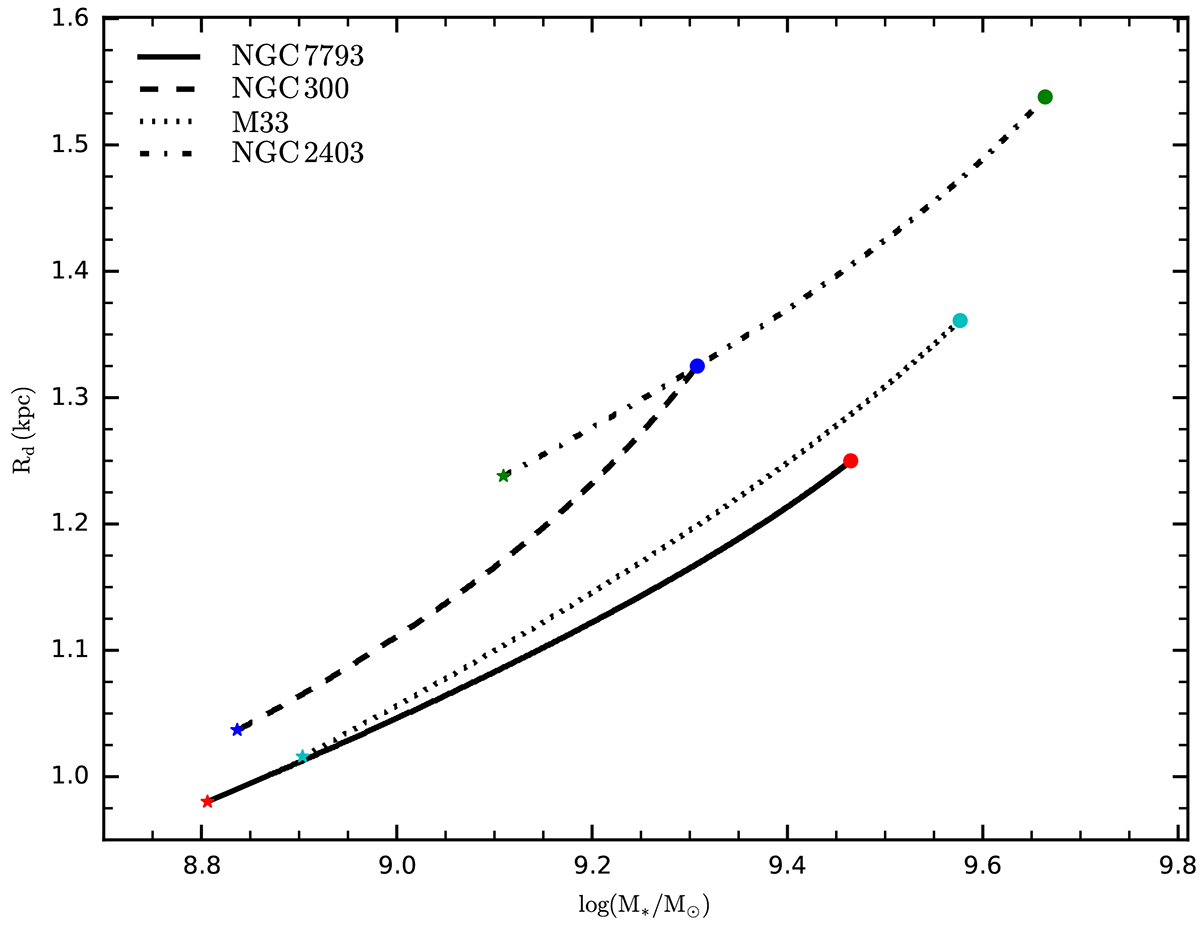
Fig. 8.
Download original image
Evolution of the scale length and total stellar mass predicted by our best-fitting models for NGC 7793 (solid line), NGC 300 (dashed line), M 33 (dotted line), and NGC 2403 (dash-dotted line). Each track follows the evolution of a galaxy from z = 1 (the z = 1 step is marked with an asterisk) to z = 0 (the z = 0 step is marked with a filled circle).
Current usage metrics show cumulative count of Article Views (full-text article views including HTML views, PDF and ePub downloads, according to the available data) and Abstracts Views on Vision4Press platform.
Data correspond to usage on the plateform after 2015. The current usage metrics is available 48-96 hours after online publication and is updated daily on week days.
Initial download of the metrics may take a while.