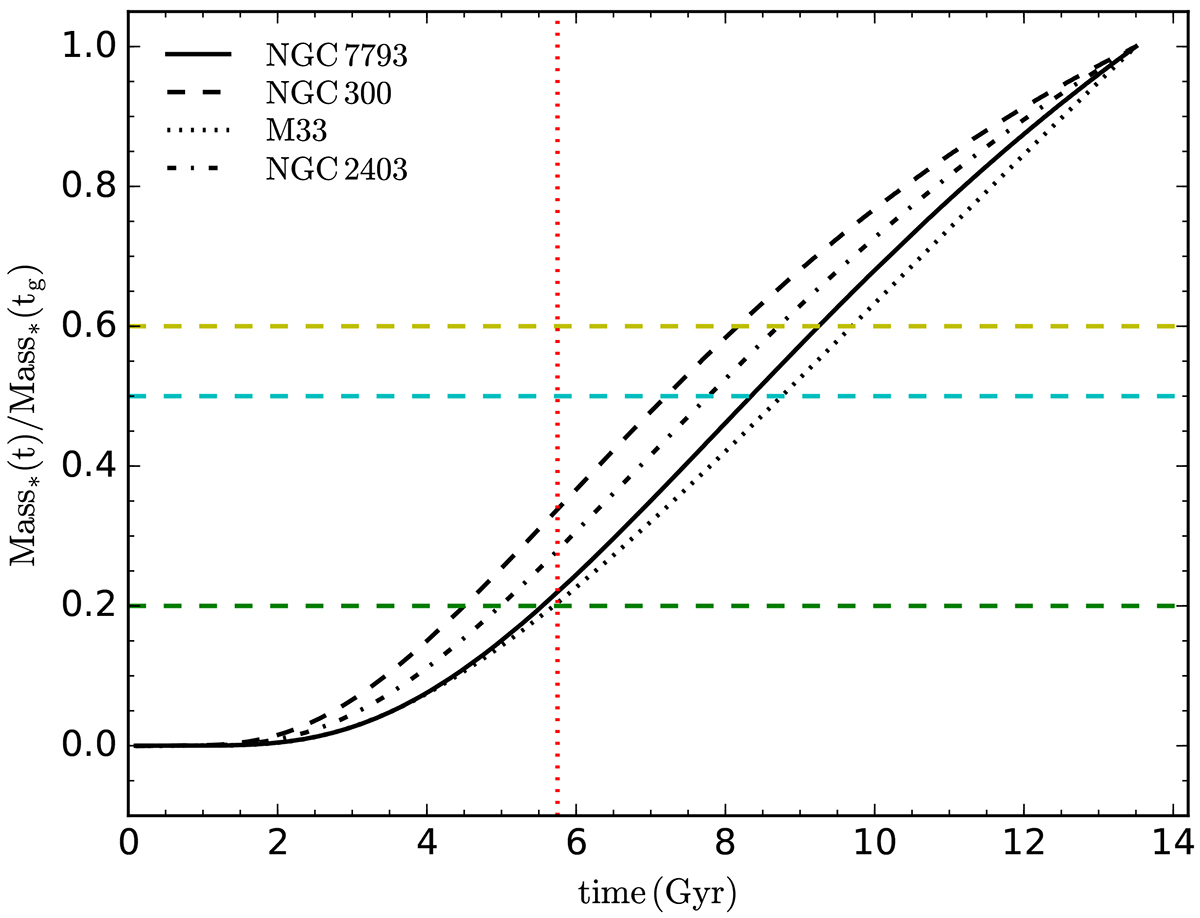
Fig. 6.
Download original image
Stellar mass growth histories of NGC 7793 (solid line), NGC 300 (dashed line), M 33 (dotted line), and NGC 2403 (dash-dotted line) predicted by the respective best-fitting models. Stellar masses are normalised to their present-day values. The horizontal dashed lines mark when the stellar mass reaches 20% (green), 50% (cyan), and 60% (yellow) of its final value, and the vertical dotted red line denotes the galaxy evolutionary age at t = 5.75 Gyr (i.e. z = 1).
Current usage metrics show cumulative count of Article Views (full-text article views including HTML views, PDF and ePub downloads, according to the available data) and Abstracts Views on Vision4Press platform.
Data correspond to usage on the plateform after 2015. The current usage metrics is available 48-96 hours after online publication and is updated daily on week days.
Initial download of the metrics may take a while.