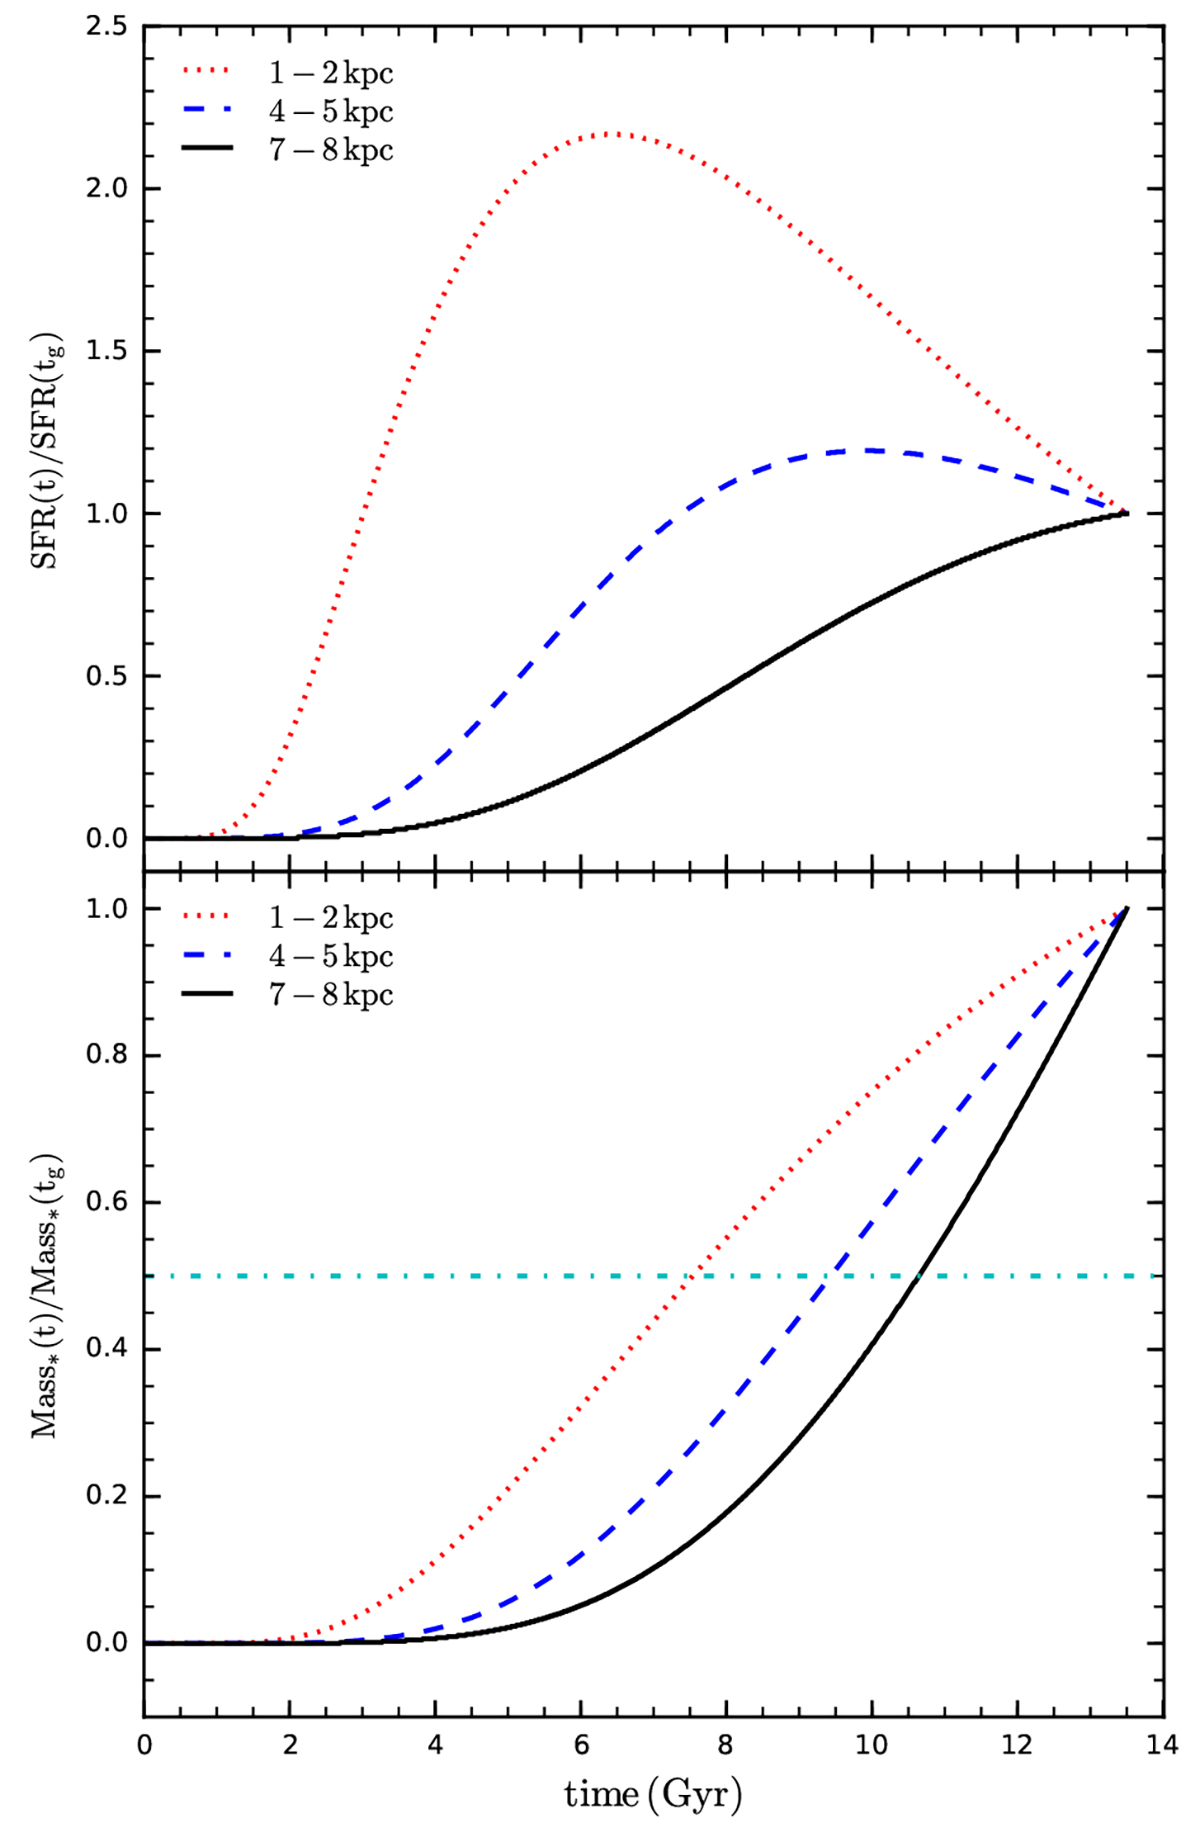
Fig. 4.
Download original image
Star formation histories (upper panel) and relative stellar mass growth (lower panel) of three regions at different galactocentric distances for the NGC 7793 disc. Different line types represent different regions along the disc, dotted red line for 1 − 2 kpc, dashed blue line for 4 − 5 kpc and solid black line for 7 − 8 kpc. Both the SFRs and stellar masses are normalised by their present-day values. The horizontal cyan dash-dotted line in the lower panel shows when each component achieves 50% of its final value.
Current usage metrics show cumulative count of Article Views (full-text article views including HTML views, PDF and ePub downloads, according to the available data) and Abstracts Views on Vision4Press platform.
Data correspond to usage on the plateform after 2015. The current usage metrics is available 48-96 hours after online publication and is updated daily on week days.
Initial download of the metrics may take a while.