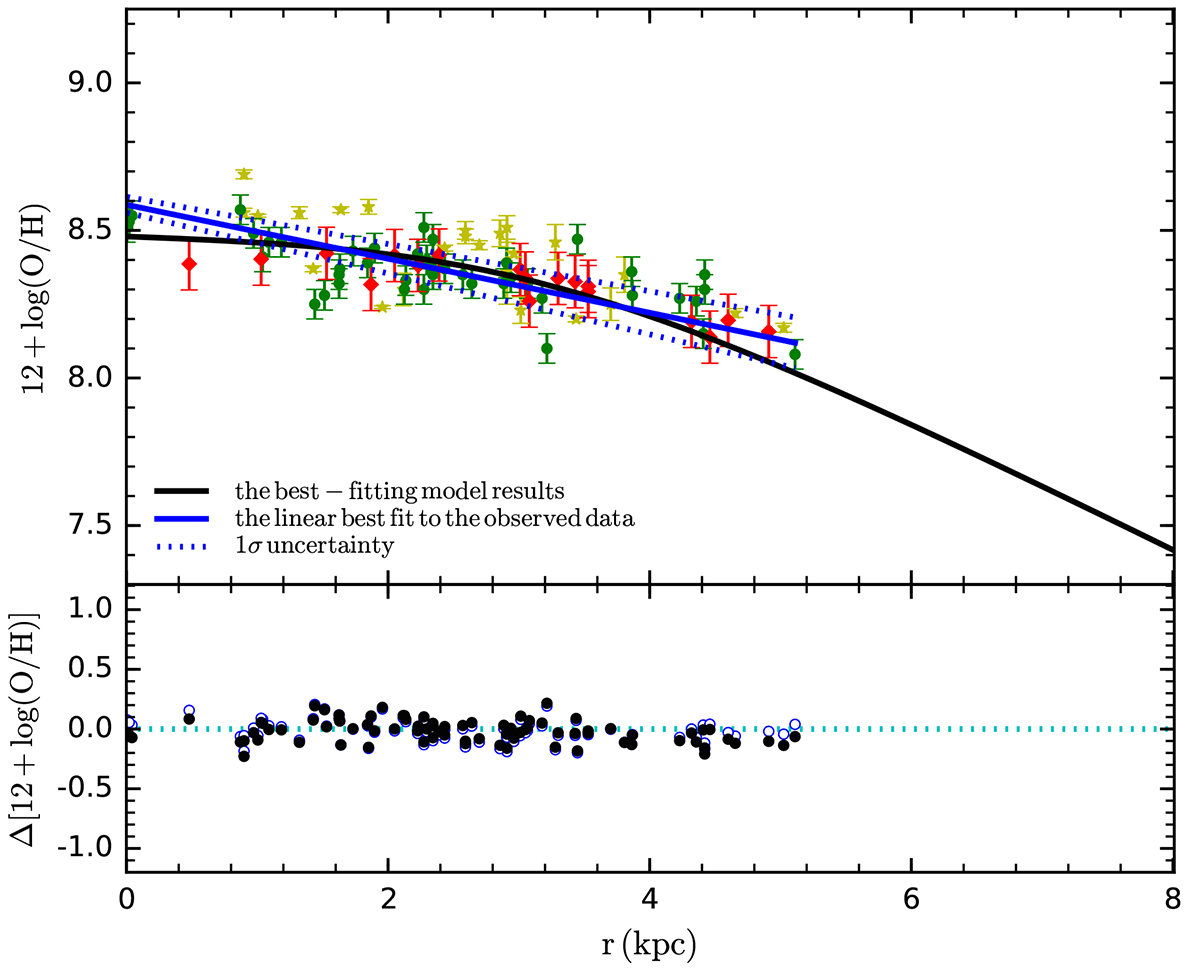
Fig. 3.
Download original image
Radial distribution of 12 + log(O/H). Upper panel: comparisons of the present-day radial distribution of 12 + log(O/H) predicted by our best-fitting model (solid black line) with the observational data. Different symbols denote the observed metallicity data from different works as filled yellow asterisks (Bibby & Crowther 2010), filled green circles (Pilyugin et al. 2014), and filled red diamonds (Stanghellini et al. 2015). The linear best fit to the observed data and 1σ uncertainty are plotted as the solid and dotted blue lines, respectively. Lower panel: filled black circles show the deviations of the observations from our best-fitting model predictions, derived by subtracting the solid black line from the observed data in the upper panel, and the open blue circles show those obtained from subtracting the linear best fit from the observational data in the upper panel.
Current usage metrics show cumulative count of Article Views (full-text article views including HTML views, PDF and ePub downloads, according to the available data) and Abstracts Views on Vision4Press platform.
Data correspond to usage on the plateform after 2015. The current usage metrics is available 48-96 hours after online publication and is updated daily on week days.
Initial download of the metrics may take a while.