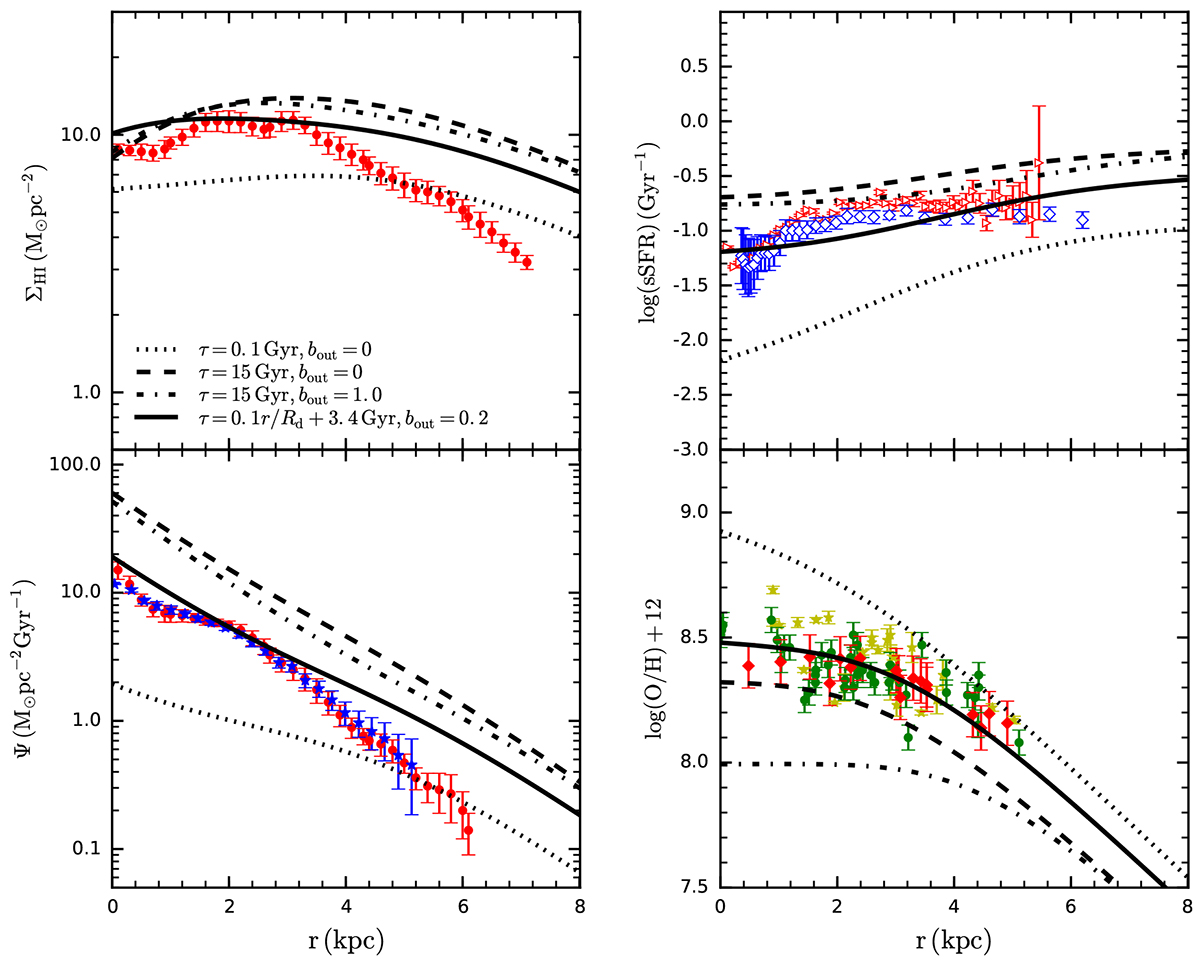
Fig. 2.
Download original image
Comparisons of model predictions with observations. The different line types correspond to different parameter groups (the dotted lines (τ, bout) show (0.1 Gyr, 0), the dashed lines (τ, bout) show (15 Gyr, 0), the dot-dashed lines (τ, bout) show (15 Gyr, 1.0), and the solid lines (τ, bout) show (0.1r/Rd + 3.4 Gyr, 0.2)). On the left side, the radial profiles of HI mass and SFR surface density are shown in the top and bottom panels, respectively. On the right side, the radial profiles of the sSFR and metallicity are displayed in the top and bottom panels, respectively. The different symbols correspond to observed data from different works. HI data from Leroy et al. (2008) are shown as filled red circles. SFR data obtained from Leroy et al. (2008) are denoted as filled red circles, and those from Casasola et al. (2017) are displayed as filled blue asterisks. The sSFR data from Muñoz-Mateos et al. (2007) and Smith et al. (2021) are denoted as open red triangles and open red diamonds, respectively. The 12 + log(O/H) data taken from Bibby & Crowther (2010), Pilyugin et al. (2014), and Stanghellini et al. (2015) are separately plotted as filled yellow asterisks, filled green circles, and filled red diamonds.
Current usage metrics show cumulative count of Article Views (full-text article views including HTML views, PDF and ePub downloads, according to the available data) and Abstracts Views on Vision4Press platform.
Data correspond to usage on the plateform after 2015. The current usage metrics is available 48-96 hours after online publication and is updated daily on week days.
Initial download of the metrics may take a while.