Open Access
Fig. 2
Download original image
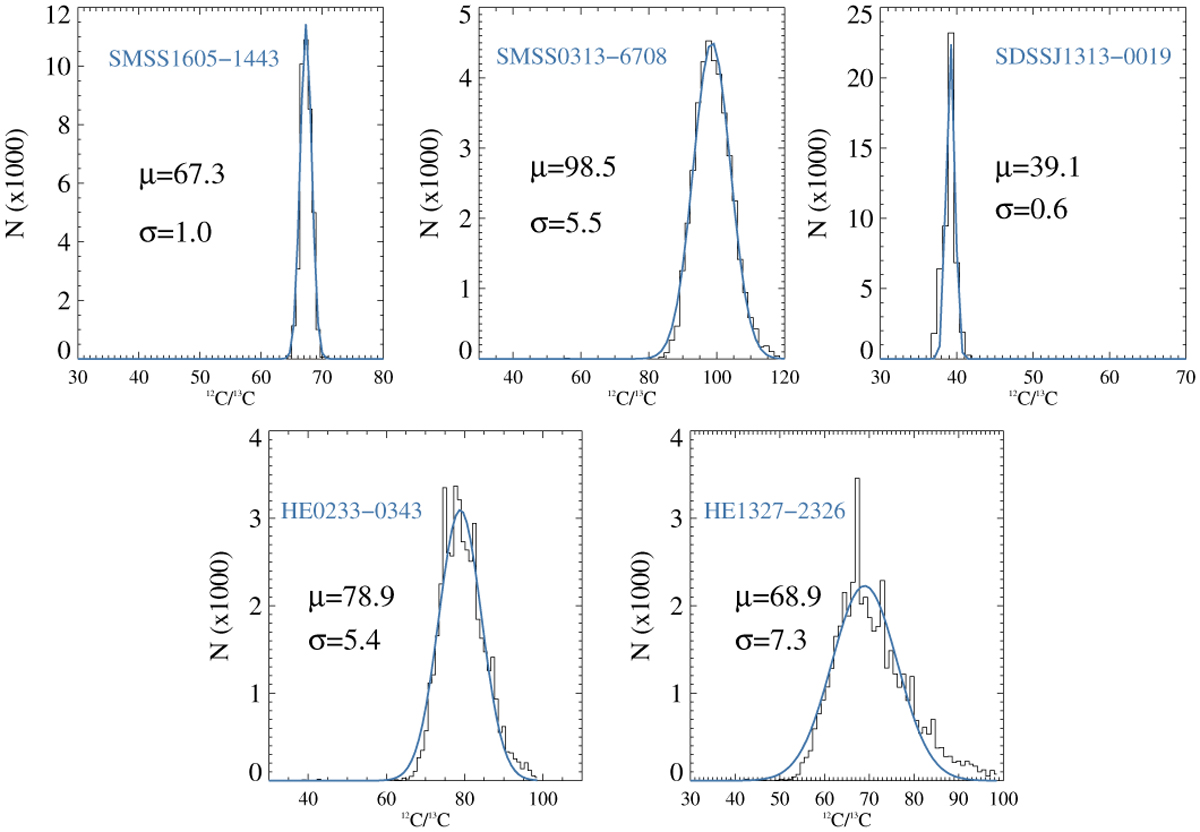
Distribution of the MCMC experiments versus the most likely 12C/13C value for each of the targets. The mean value and typical deviation are displayed to provide a summary of the results.
Current usage metrics show cumulative count of Article Views (full-text article views including HTML views, PDF and ePub downloads, according to the available data) and Abstracts Views on Vision4Press platform.
Data correspond to usage on the plateform after 2015. The current usage metrics is available 48-96 hours after online publication and is updated daily on week days.
Initial download of the metrics may take a while.