Fig. 8
Download original image
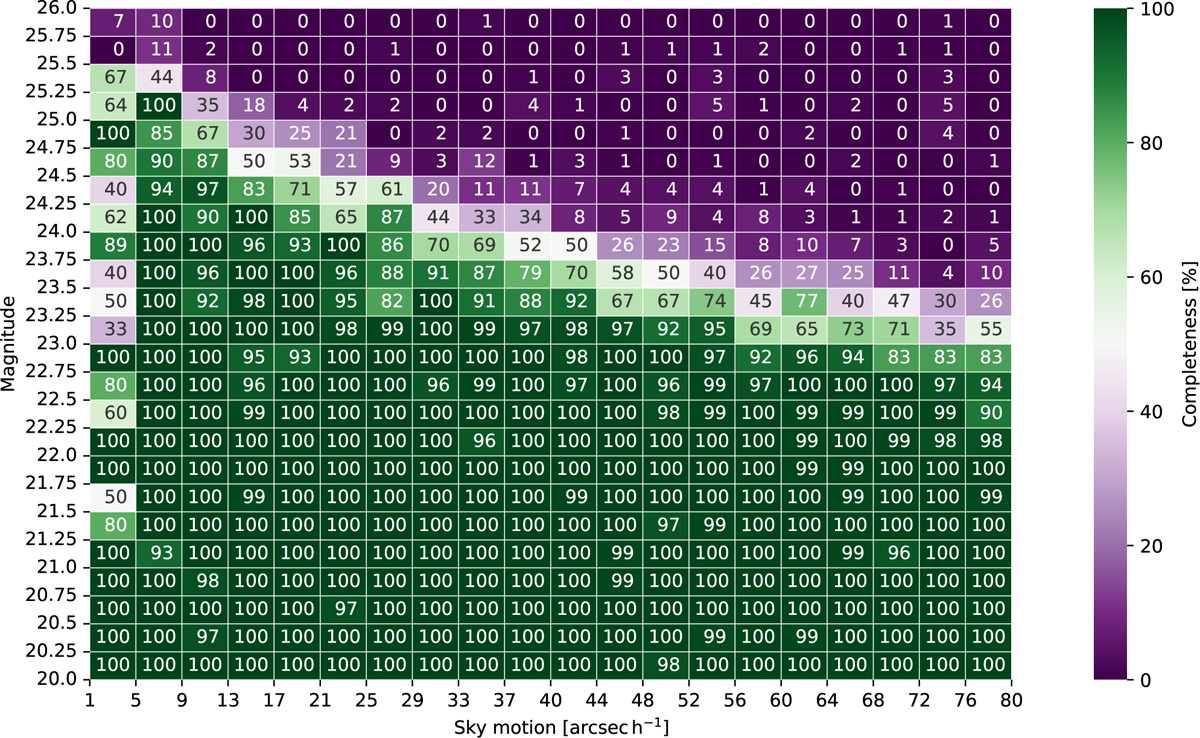
CNN cutout test set classification completeness as functions of apparent magnitude and apparent motion. The values on both axes mark the bin edges. For example, the bin between sky motions of 9 and 13 arcsec h−1 and magnitudes of 20.25 and 20.5 shows that the detection completeness is 97% for streaks created by all simulated SSOs between those values. There are 91 ground-truth streaks per bin on average.
Current usage metrics show cumulative count of Article Views (full-text article views including HTML views, PDF and ePub downloads, according to the available data) and Abstracts Views on Vision4Press platform.
Data correspond to usage on the plateform after 2015. The current usage metrics is available 48-96 hours after online publication and is updated daily on week days.
Initial download of the metrics may take a while.