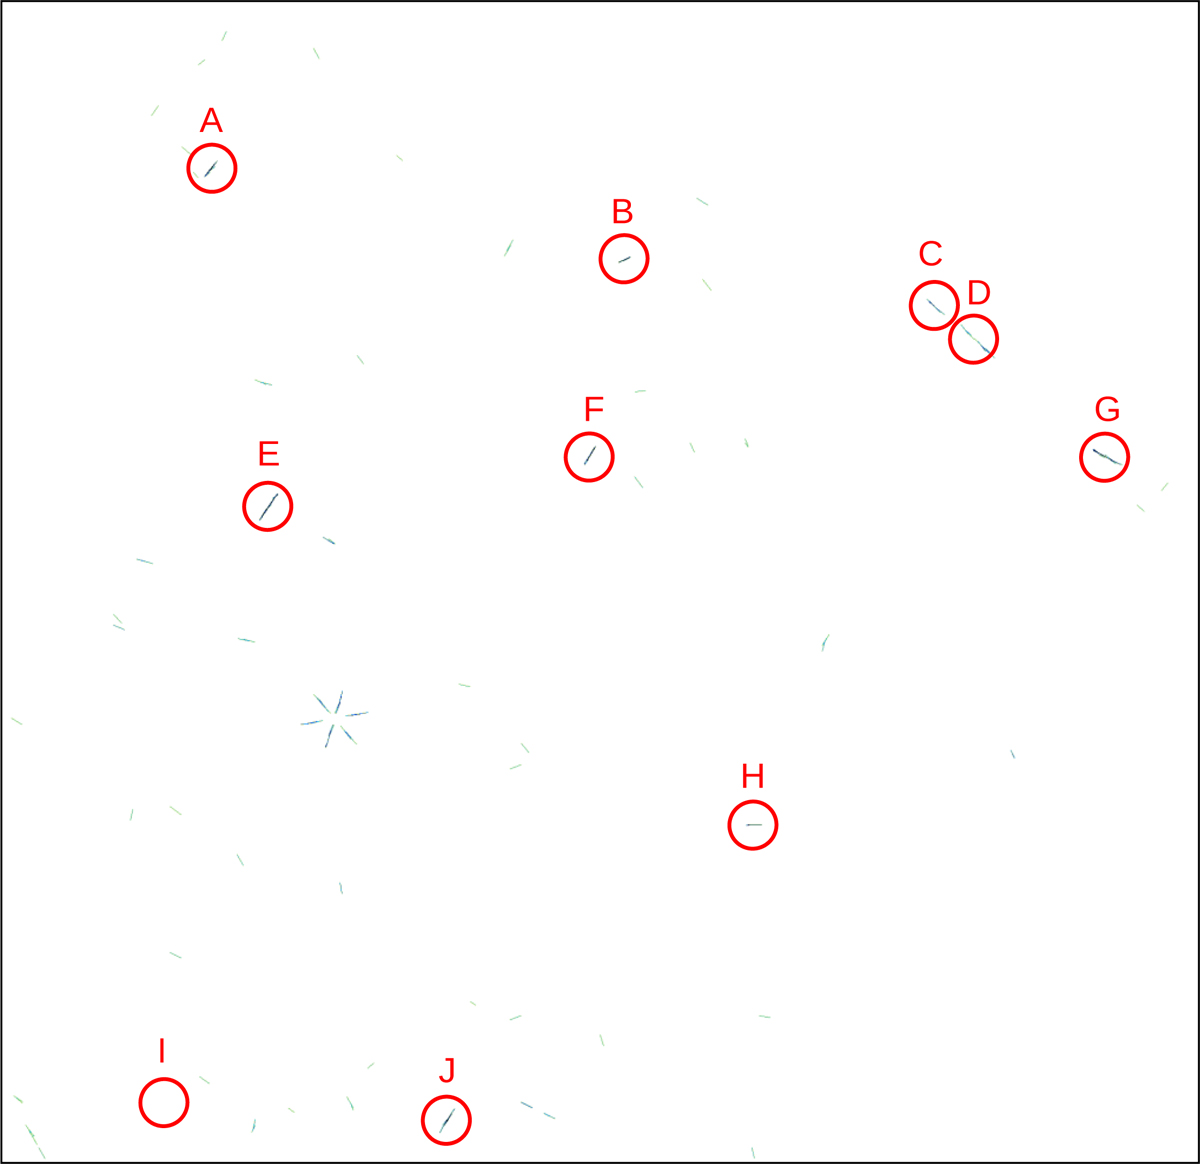
Fig. 7
Download original image
Output catalog of the sliding-window CNN visualized. The input image given to the CNN was the same as in Fig. 1. The detected streaklets in the CNN output catalog are drawn in their predicted coordinates, and the pixel brightness corresponds to the prediction label certainty of the CNN, i.e., the darkest pixels have the highest predicted labels. Streaks with predicted labels of smaller than 0.5 are left out. Pixels with overlapping streaks have been set to the highest predicted label value between those streaks. In this example, the CNN method has detected all asteroids except for the practically invisible asteroid I. There are multiple false-positive detections, although their prediction labels typically have lower values than the asteroid streaks. The six streaks caused by a bright star below asteroid E are notable exceptions.
Current usage metrics show cumulative count of Article Views (full-text article views including HTML views, PDF and ePub downloads, according to the available data) and Abstracts Views on Vision4Press platform.
Data correspond to usage on the plateform after 2015. The current usage metrics is available 48-96 hours after online publication and is updated daily on week days.
Initial download of the metrics may take a while.