Fig. 2
Download original image
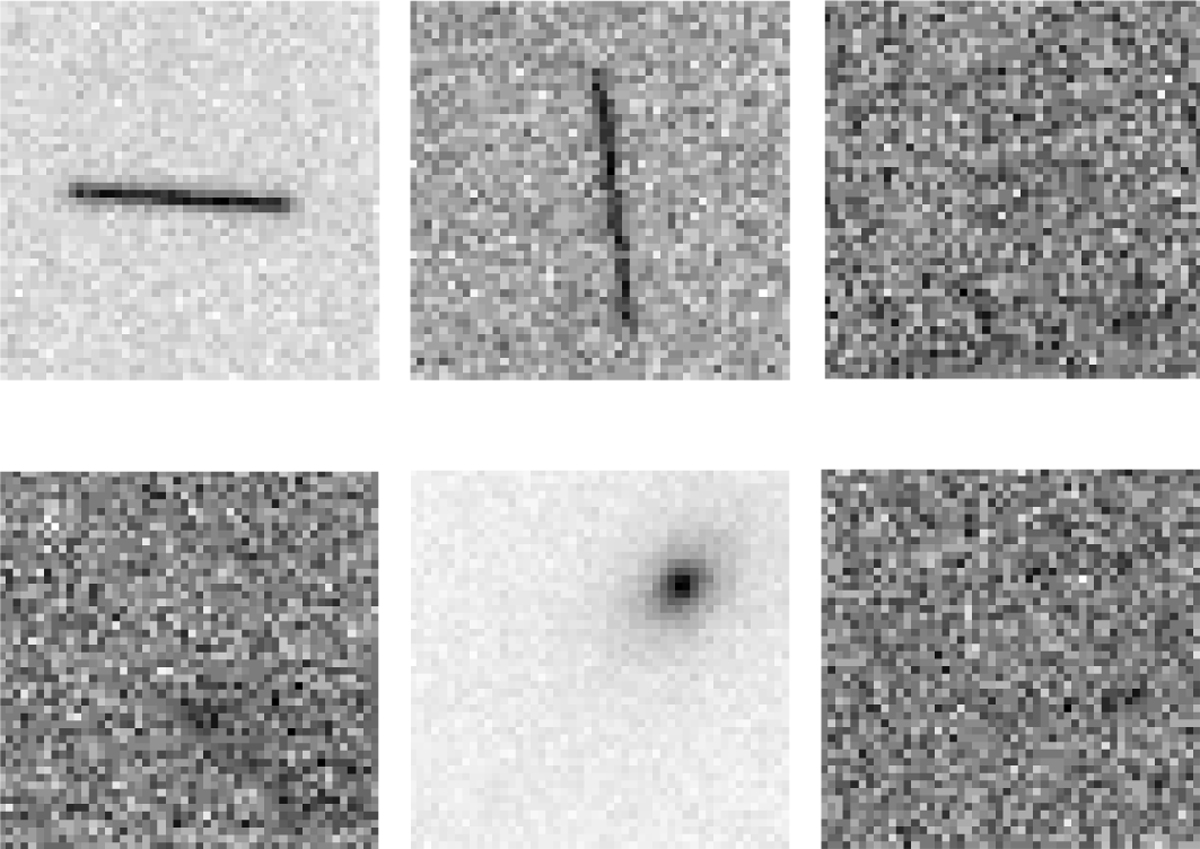
Examples of cutout images generated from the simulated data for the CNN training and test sets. The single-channel cutouts shown are 50 pixels (5 arcsec) in height and width. The top row shows positive training examples, namely asteroid streaks. The streaks are centered training examples. As seen from the third positive example (top right), some generated asteroid streaks are so faint that they are practically invisible. The bottom row shows negative training examples, specifically images that do not contain asteroid streaks.
Current usage metrics show cumulative count of Article Views (full-text article views including HTML views, PDF and ePub downloads, according to the available data) and Abstracts Views on Vision4Press platform.
Data correspond to usage on the plateform after 2015. The current usage metrics is available 48-96 hours after online publication and is updated daily on week days.
Initial download of the metrics may take a while.