Fig. 1
Download original image
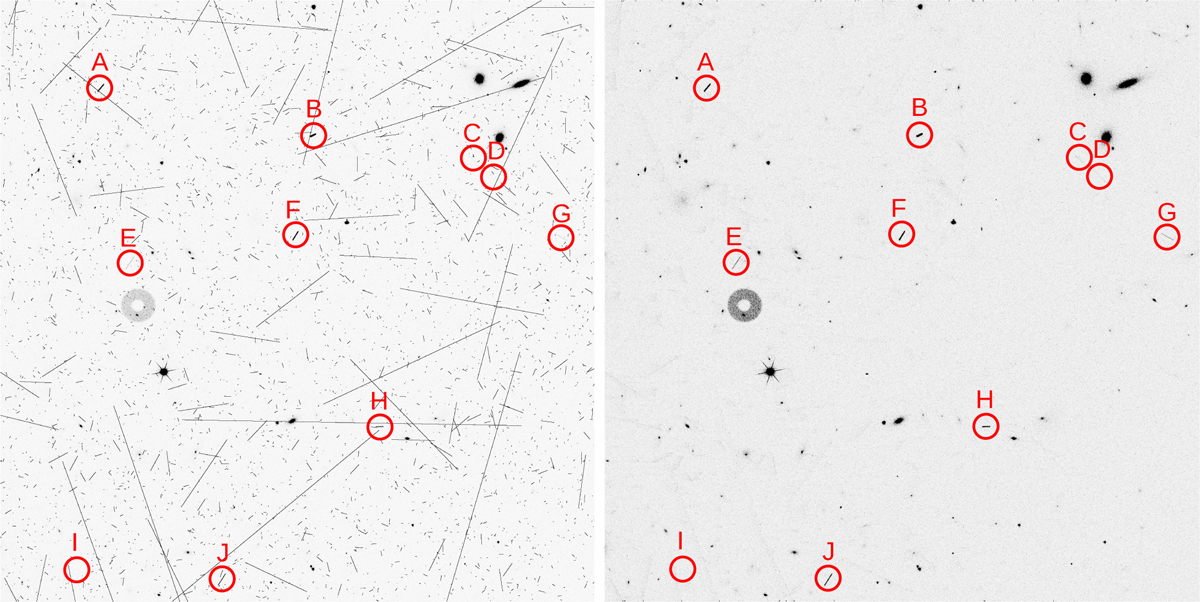
Example of the simulated VIS data. The left image shows a quadrant of a raw CCD file with a size of 2048 × 2066 pixels (204.8 × 206.6 arcsec). Asteroids are marked with red circles. The other streaks are simulated cosmic rays. On the right is the same image after removing cosmic rays. The dark objects above asteroids C and D are galaxies, the circle below asteroid E is a ghost reflection of a bright star, and the spot further down with six outward lines is a star with diffraction spikes. Streaks A, B, F, H, and J are quite bright and easily seen (magnitudes 20.3–22.2), while C, D, E, and G are fainter and harder to see (magnitudes 22.6–23.9), and finally, streak I is practically invisible (magnitude 25.0). The velocities range from 14 arcsech−1 (asteroid B) to 56 arcsech−1 (asteroid D).
Current usage metrics show cumulative count of Article Views (full-text article views including HTML views, PDF and ePub downloads, according to the available data) and Abstracts Views on Vision4Press platform.
Data correspond to usage on the plateform after 2015. The current usage metrics is available 48-96 hours after online publication and is updated daily on week days.
Initial download of the metrics may take a while.