Open Access
Fig. 3.
Download original image
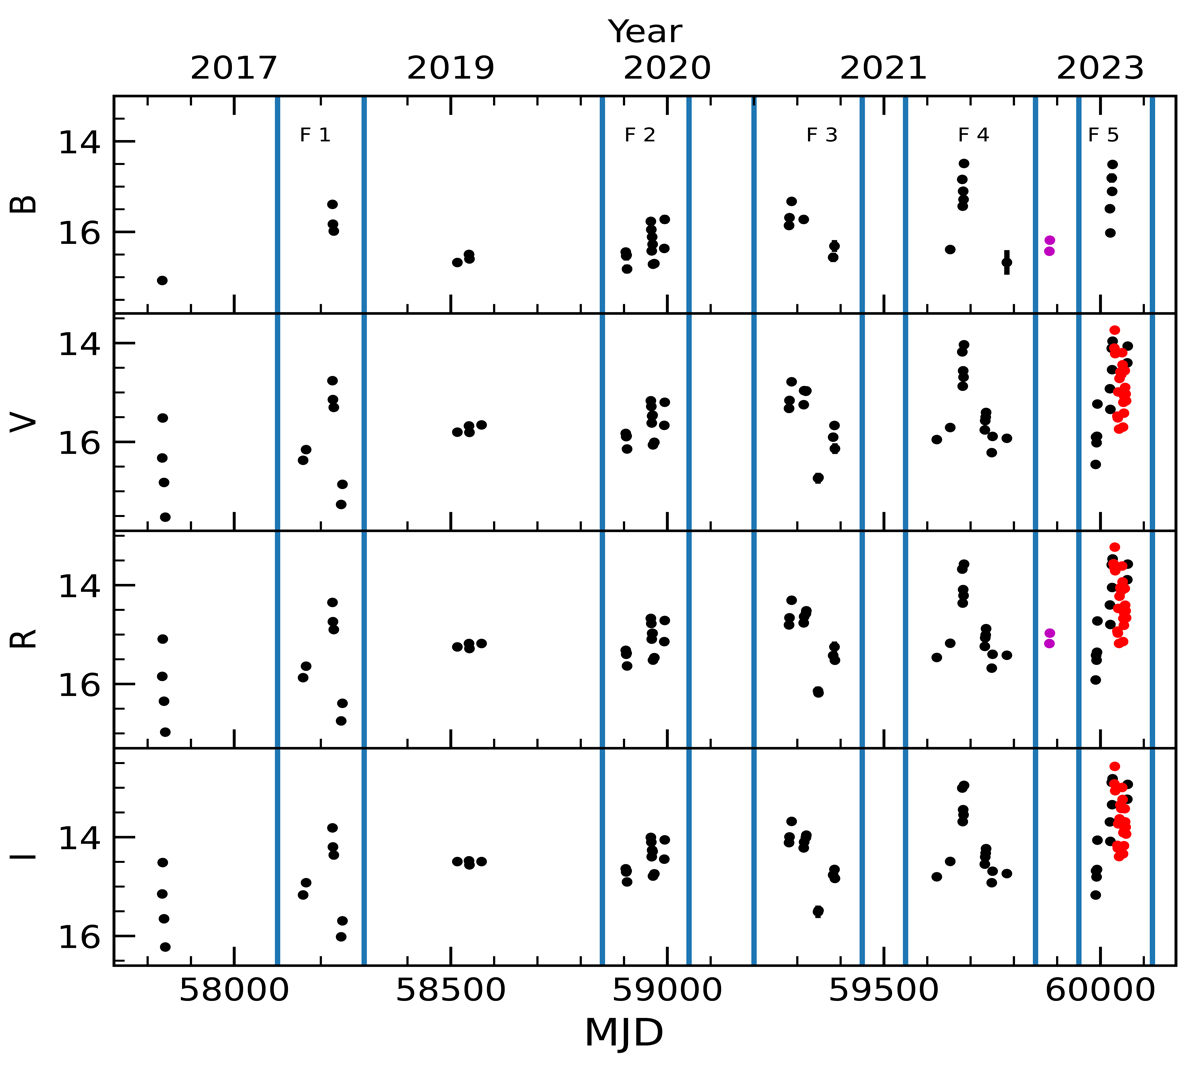
Long-term light curves of S4 0954+65 in B, V, R, and I bands. Here, the observations performed with telescopes A, B, and C are indicated in black, magenta, and red, respectively. The vertical lines indicate the epochs of flaring events F1, F2, F3, F4, and F5.
Current usage metrics show cumulative count of Article Views (full-text article views including HTML views, PDF and ePub downloads, according to the available data) and Abstracts Views on Vision4Press platform.
Data correspond to usage on the plateform after 2015. The current usage metrics is available 48-96 hours after online publication and is updated daily on week days.
Initial download of the metrics may take a while.