Open Access
Fig. 10.
Download original image
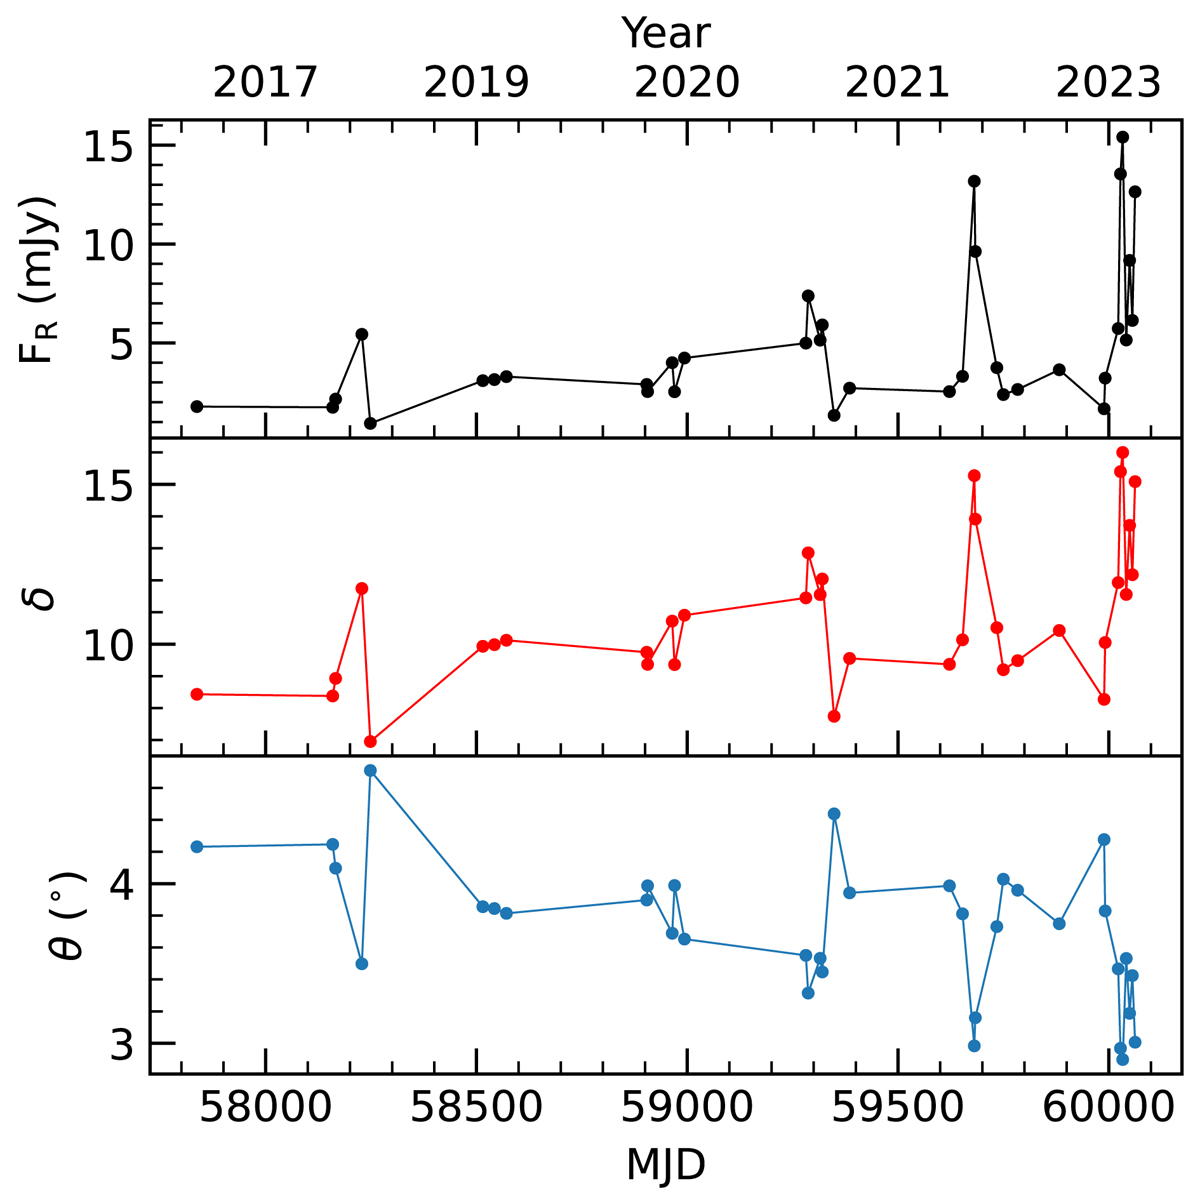
Temporal variation of the weekly binned R-band flux (top panel) together with the corresponding variation in the Doppler factor (middle panel), and the viewing angle (bottom panel) of the emission region based on the model of Raiteri et al. (2021b).
Current usage metrics show cumulative count of Article Views (full-text article views including HTML views, PDF and ePub downloads, according to the available data) and Abstracts Views on Vision4Press platform.
Data correspond to usage on the plateform after 2015. The current usage metrics is available 48-96 hours after online publication and is updated daily on week days.
Initial download of the metrics may take a while.