Fig. 1
Download original image
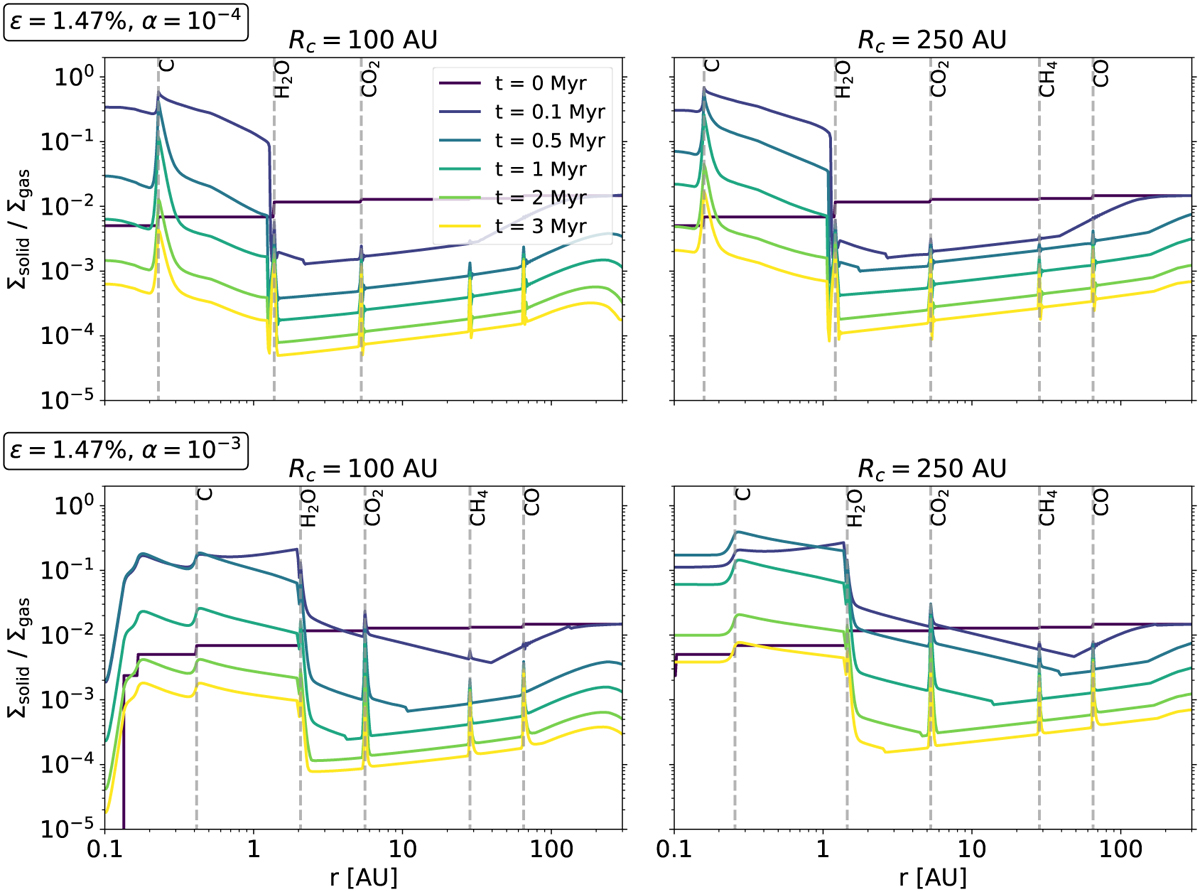
Time evolution of the dust-to-gas ratio in protoplanetary discs with α = 10−4 (top) and α = 10−3 (bottom) and disc radii of Rc = 100 AU (left) and Rc = 250 AU (right). The vertical lines indicate the evaporation fronts of the different chemical species, where inward-drifting pebbles evaporate and recondense, leading to pile-ups in the solid density.
Current usage metrics show cumulative count of Article Views (full-text article views including HTML views, PDF and ePub downloads, according to the available data) and Abstracts Views on Vision4Press platform.
Data correspond to usage on the plateform after 2015. The current usage metrics is available 48-96 hours after online publication and is updated daily on week days.
Initial download of the metrics may take a while.