Fig. 8.

Download original image
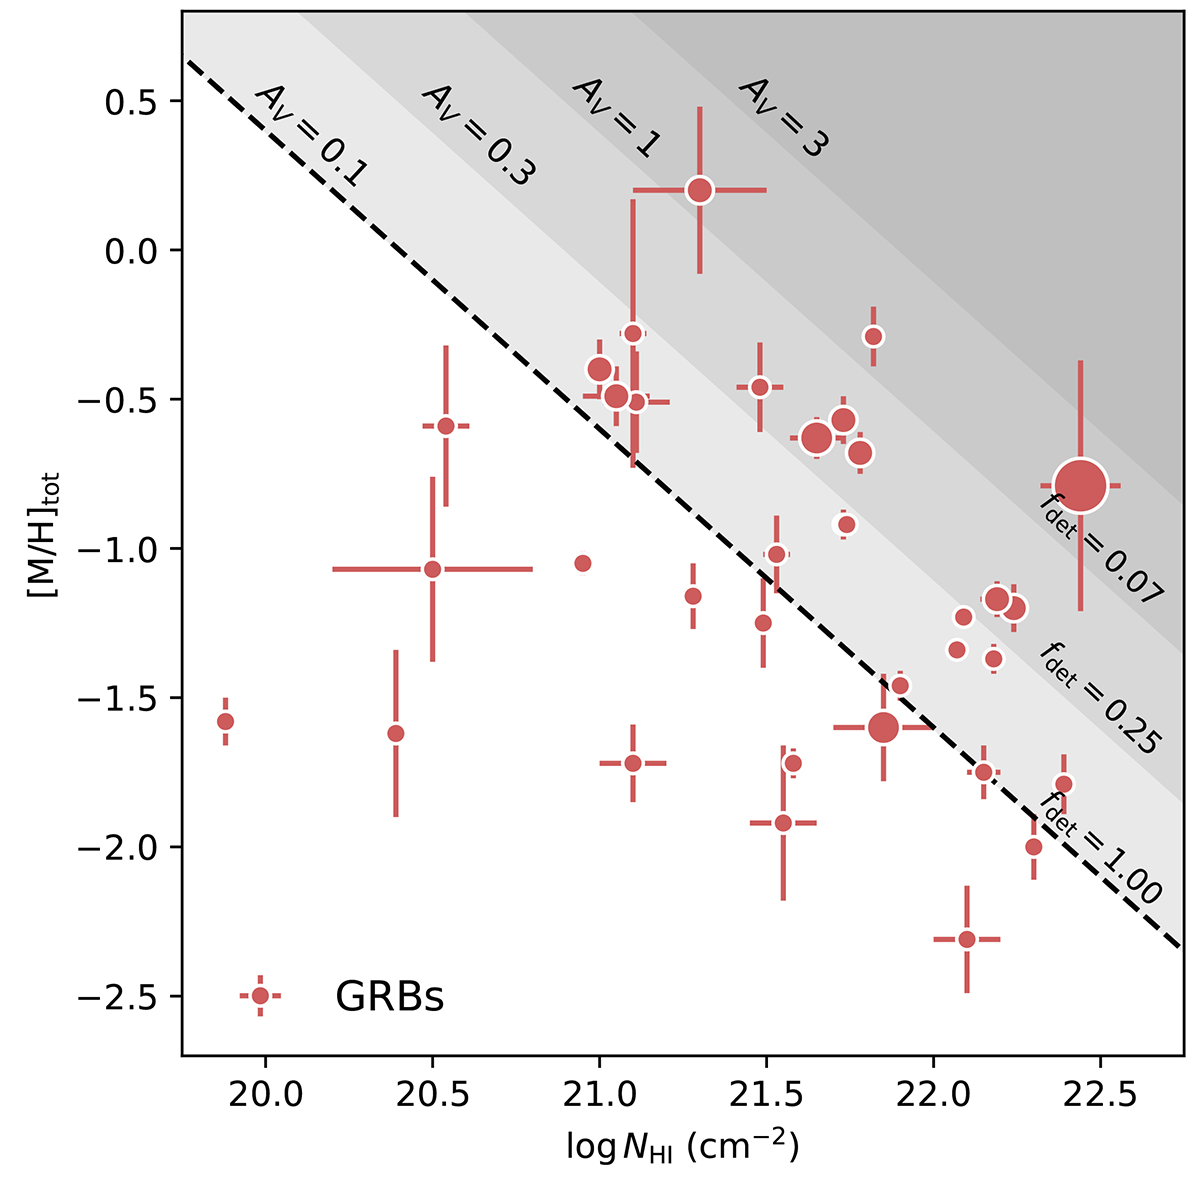
Dust-corrected metallicity as a function of H I column density. The red dots again represent the main GRB sample but here are size-coded as a function of the SED-derived AV. The gray-shaded regions represent increasing AV, marked for each region, assuming the constant DTMSED ratio derived in this work of log AV − [log NHI + [M/H]tot]= − 21.4. The estimated detection probability for GRBs in each of these AV ranges is marked as well (see Sect. 4.4 for further details).
Current usage metrics show cumulative count of Article Views (full-text article views including HTML views, PDF and ePub downloads, according to the available data) and Abstracts Views on Vision4Press platform.
Data correspond to usage on the plateform after 2015. The current usage metrics is available 48-96 hours after online publication and is updated daily on week days.
Initial download of the metrics may take a while.


