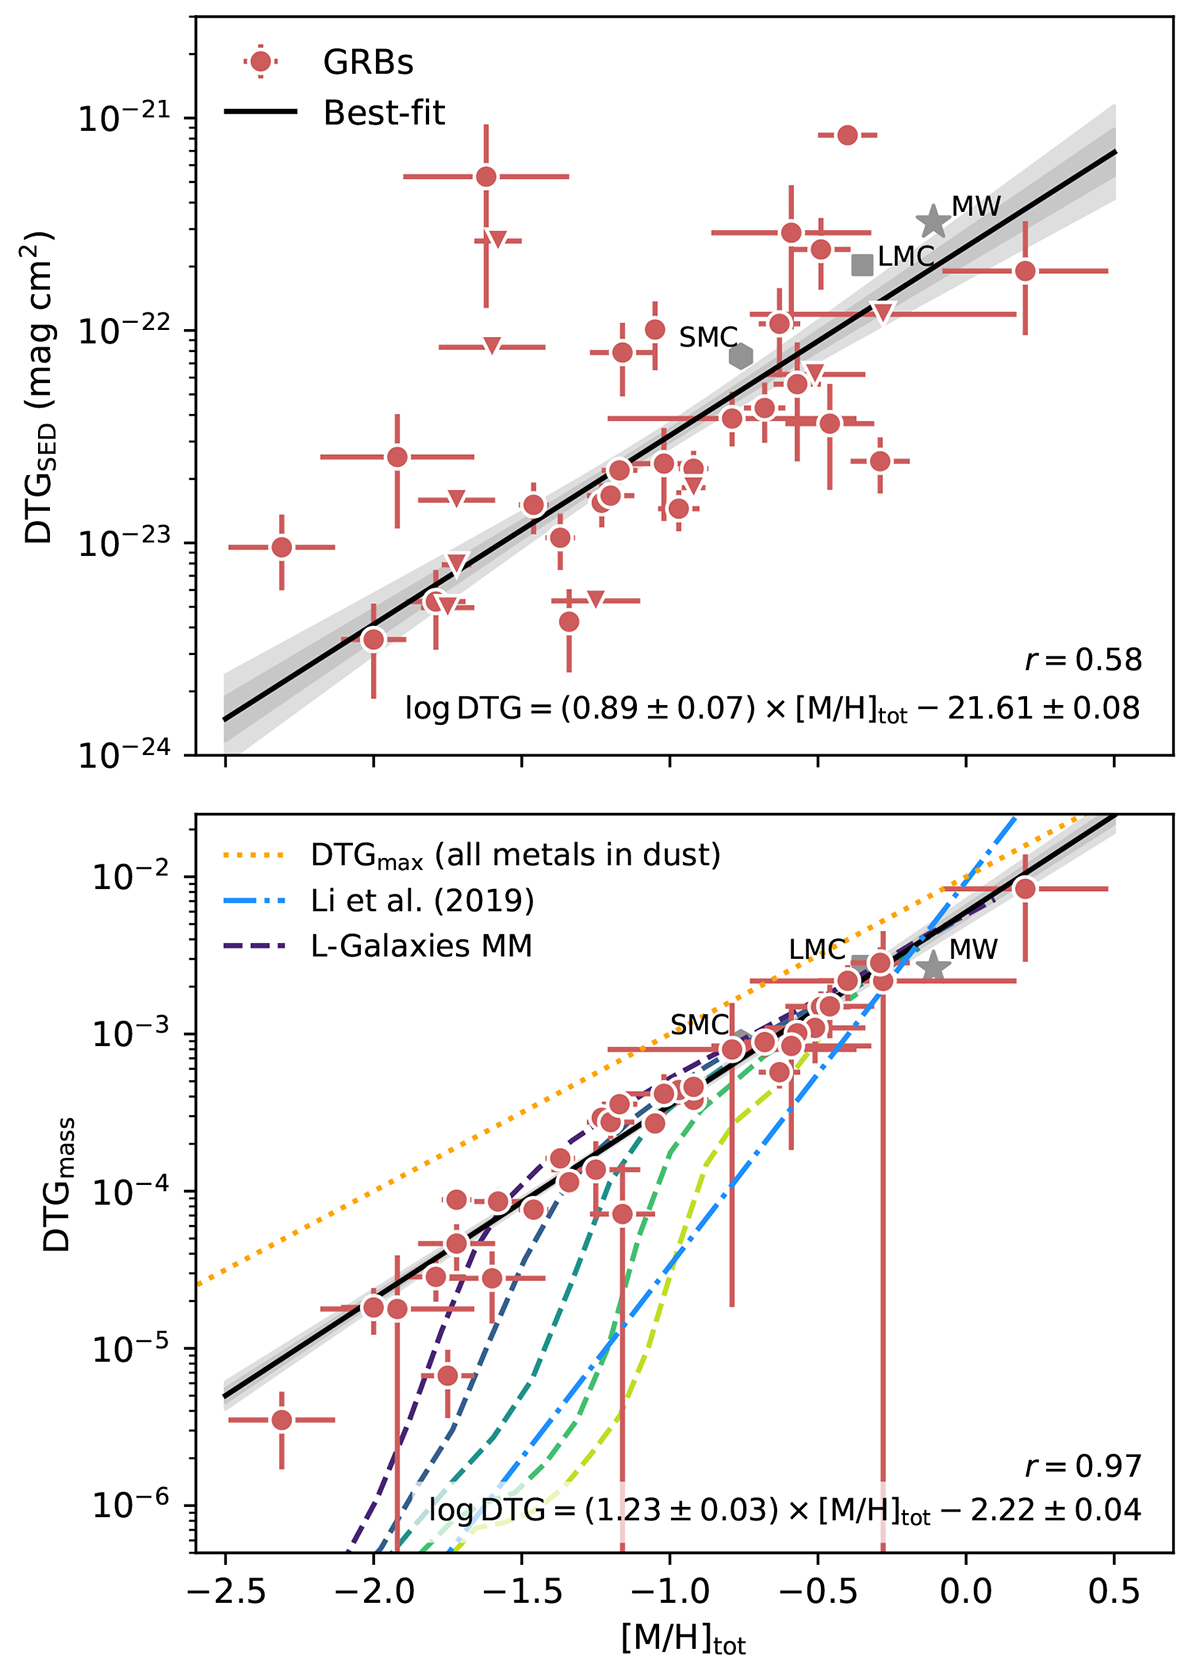
Fig. 7.
Download original image
SED-derived DTG ratio, DTGSED = AV/NHI (top), and depletion-derived DTGmass (bottom) as a function of dust-corrected metallicity, [M/H]tot. The symbol notation follows Fig. 3. We find strong correlations between the DTG inferred both from the SED (top panel) and from depletion (bottom panel) with the metallicity. In the bottom panel we also show the predictions from the Simba simulation at z ∼ 0 − 6 (dotted blue line; Li et al. 2019) and the L-Galaxies MM simulation at z ∼ 2 − 6 (dashed lines; Yates et al., in prep.). The dashed orange line is the limit at which all metals are incorporated into grains (DTM = 1).
Current usage metrics show cumulative count of Article Views (full-text article views including HTML views, PDF and ePub downloads, according to the available data) and Abstracts Views on Vision4Press platform.
Data correspond to usage on the plateform after 2015. The current usage metrics is available 48-96 hours after online publication and is updated daily on week days.
Initial download of the metrics may take a while.