Fig. 3.
Download original image
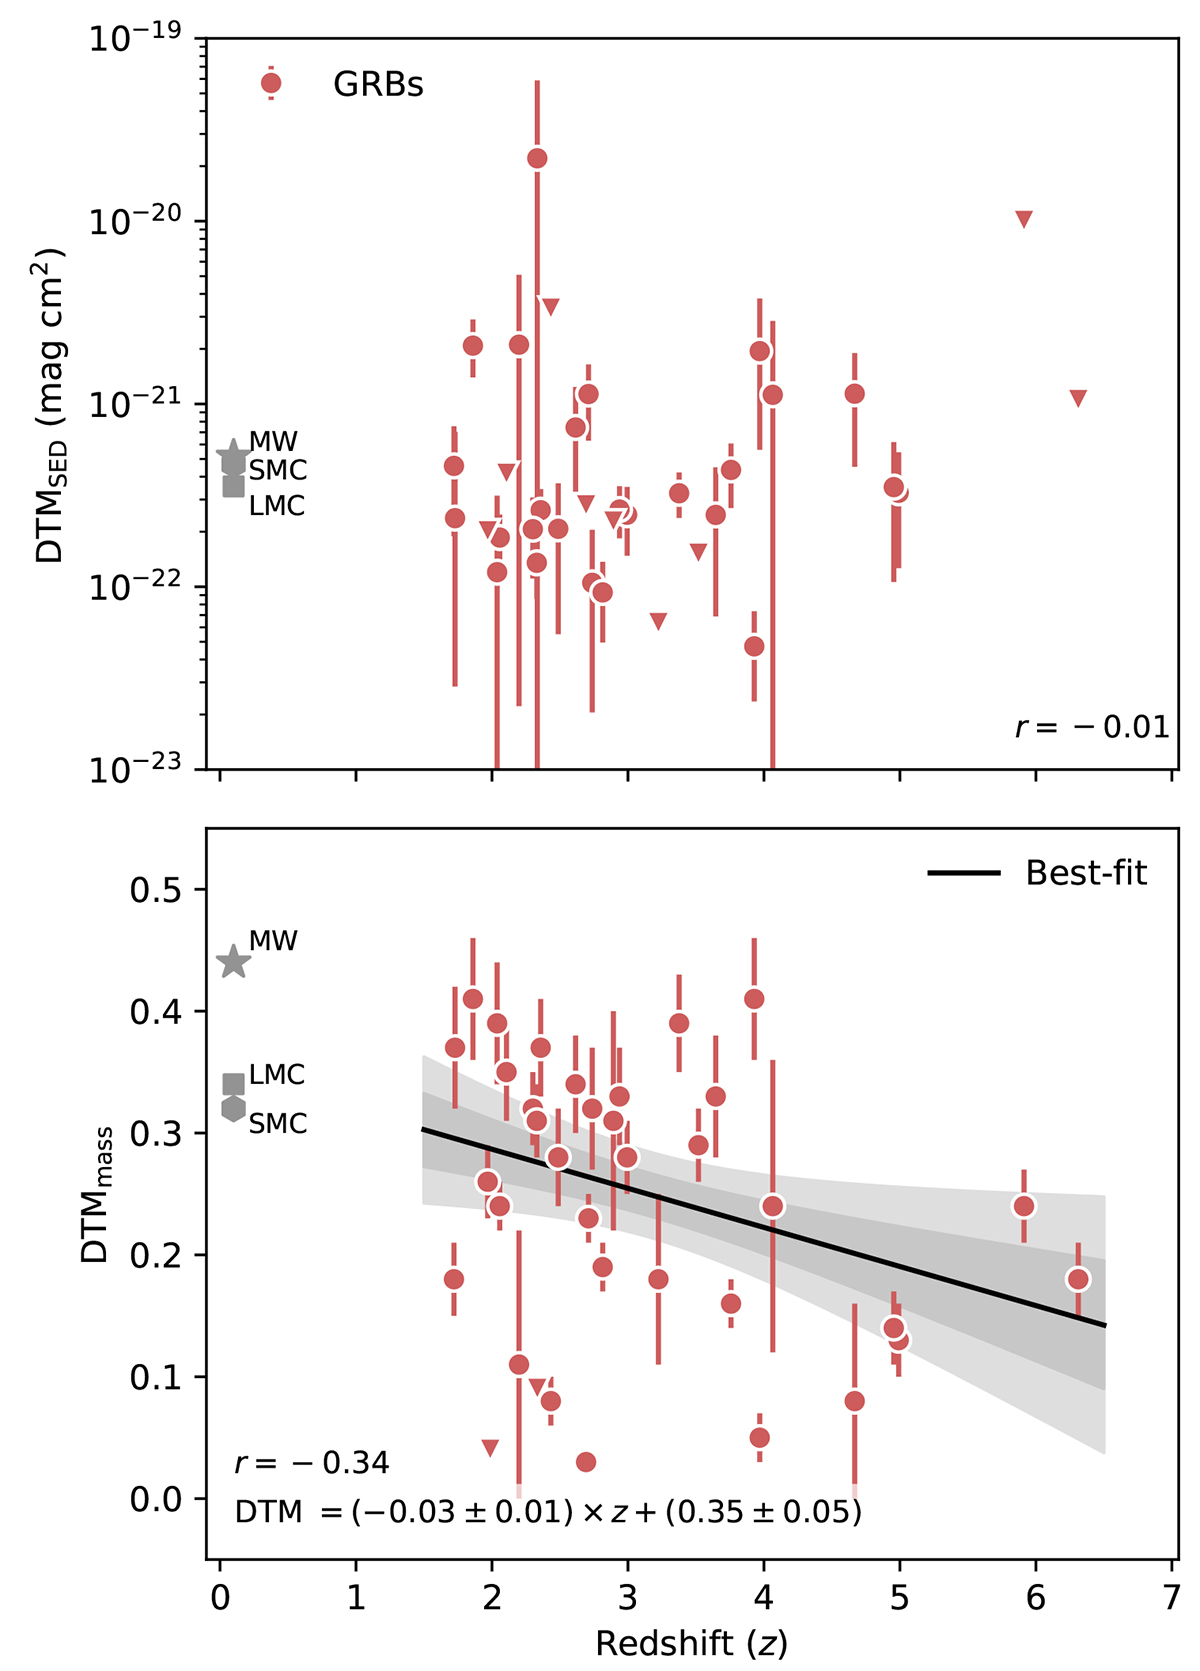
SED-derived DTM ratio, DTMSED = log AV − (log NHI + [M/H]tot) (top), and depletion-derived DTMmass ratio (bottom) as a function of redshift. Red dots (measurements) and triangles (1σ upper limits) denote the GRB host-galaxy absorbers. Gray symbols show the equivalent values for the MW, LMC, and SMC. The Pearson correlation coefficients, r, are marked for each data set. We observe no clear evolution of DTMSED with redshift but do see a mild evolution of DTMmass; the best-fit relation is shown as the solid black line, and the dark- and light-shaded gray regions indicate the 1 and 2σ confidence intervals.
Current usage metrics show cumulative count of Article Views (full-text article views including HTML views, PDF and ePub downloads, according to the available data) and Abstracts Views on Vision4Press platform.
Data correspond to usage on the plateform after 2015. The current usage metrics is available 48-96 hours after online publication and is updated daily on week days.
Initial download of the metrics may take a while.