Open Access
Fig. A.2.
Download original image
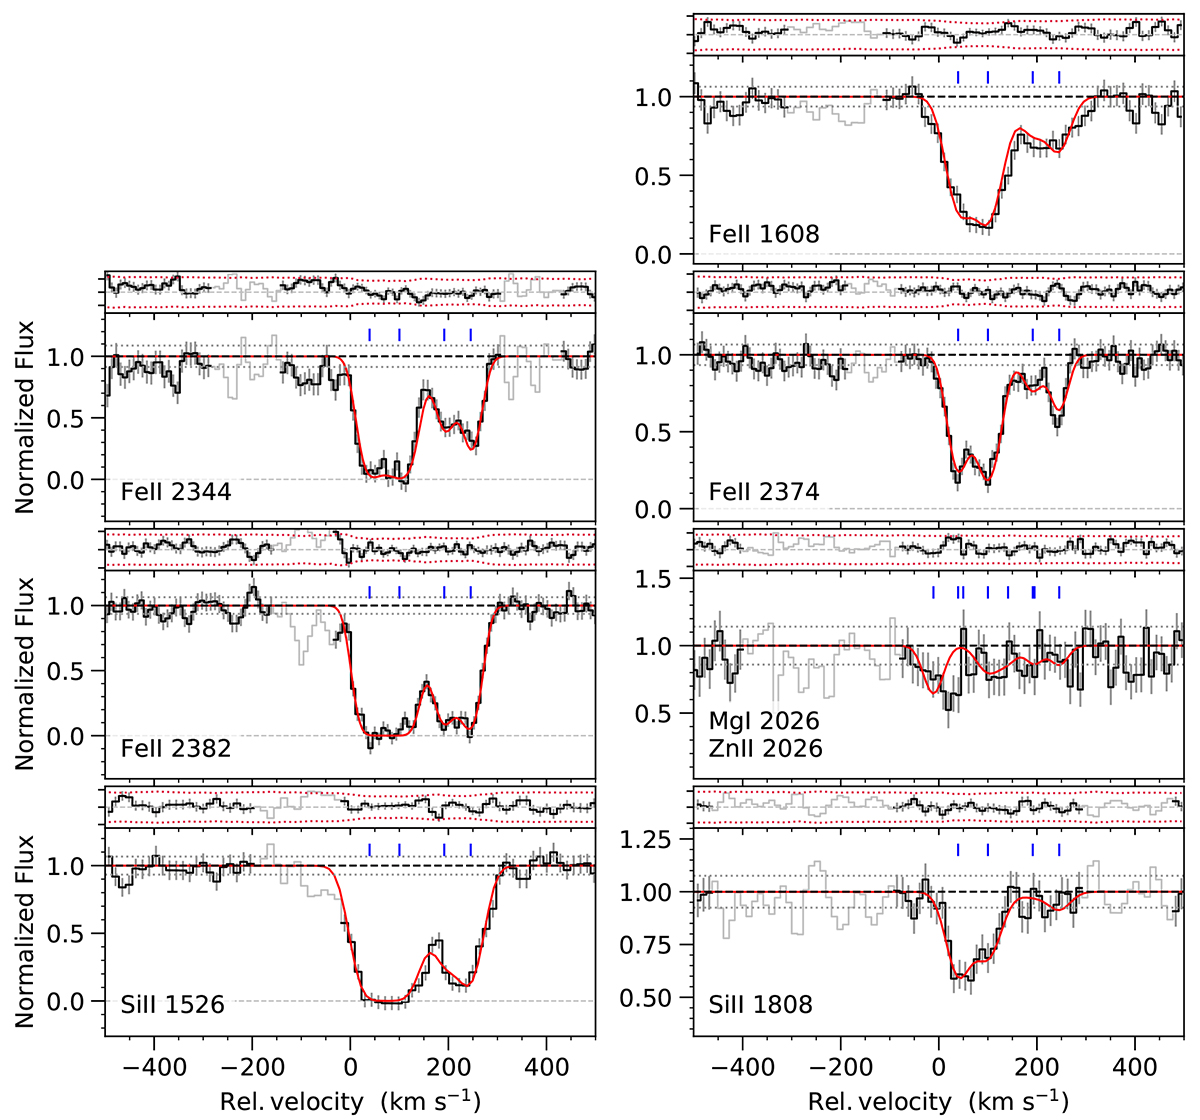
Metal absorption-line modeling of GRB 190106A. The normalized VLT/X-shooter spectrum is shown in black, with the best-fit Voigt profiles to each of the line transitions and velocity components (marked in blue) shown by the red curves. At the top of each panel are shown the residual plots.
Current usage metrics show cumulative count of Article Views (full-text article views including HTML views, PDF and ePub downloads, according to the available data) and Abstracts Views on Vision4Press platform.
Data correspond to usage on the plateform after 2015. The current usage metrics is available 48-96 hours after online publication and is updated daily on week days.
Initial download of the metrics may take a while.