Fig. 1.
Download original image
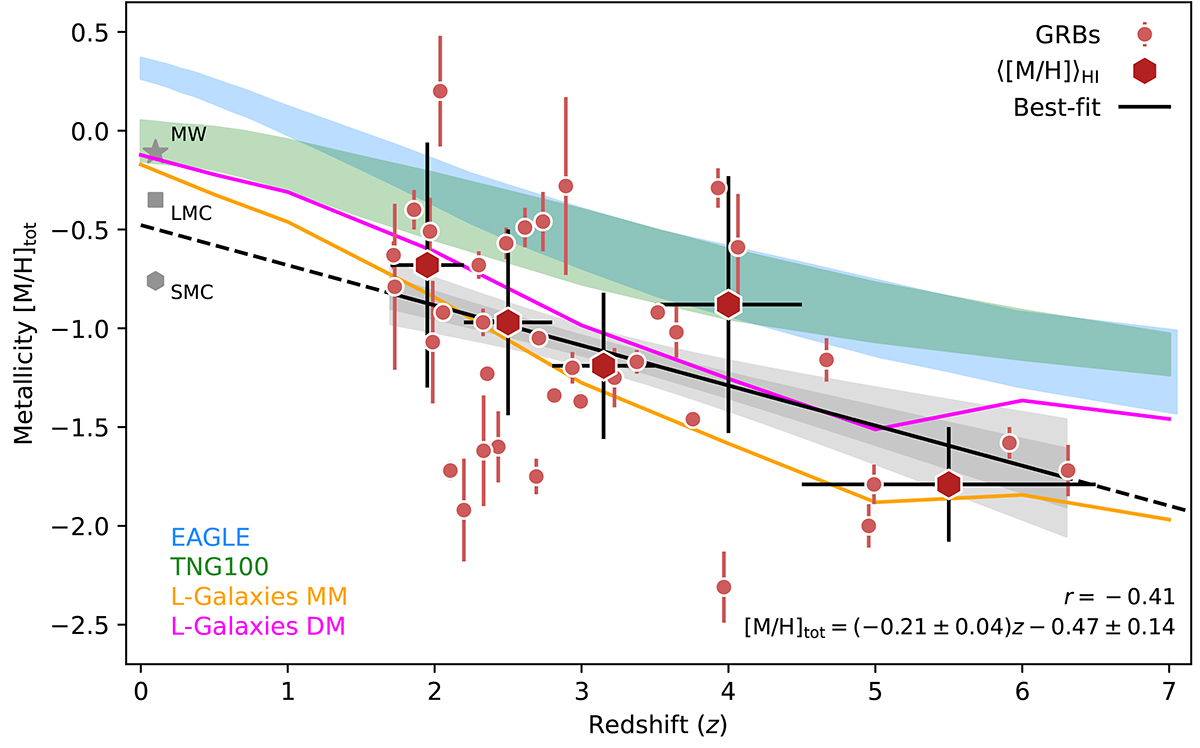
Dust-corrected metallicity [M/H]tot as a function redshift for the GRB-selected galaxies. The small red data points show individual measurements, and the large red hexagons represent the H I-weighted means with redshift, where the error bars denote the redshift interval and 1σ dispersion, respectively. The best-fit relation [M/H]tot(z) = (−0.21 ± 0.04)z − (0.47 ± 0.14) is shown as the solid black line, with the dark- and light-shaded gray regions indicating the 1 and 2σ confidence intervals. For comparison, we overplot the average dust-corrected metallicities of MW, LMC, and SMC sightlines and predictions from the compiled set of simulations from Yates et al. (2021b): the DM and MM from the L-Galaxies simulations (Henriques et al. 2020; Yates et al. 2021a), the EAGLE simulations (Crain et al. 2015; Schaye et al. 2015), and the IllustrisTNG-100 (Pillepich et al. 2018; Springel et al. 2018). Generally, all observations and simulations seem to find similar slopes of #x0394;log(O/H)/#x0394;z ≈ 0.1 − 0.3. However, only the L-Galaxies simulations are able to reproduce the lower average metallicities inferred from the GRB sightlines.
Current usage metrics show cumulative count of Article Views (full-text article views including HTML views, PDF and ePub downloads, according to the available data) and Abstracts Views on Vision4Press platform.
Data correspond to usage on the plateform after 2015. The current usage metrics is available 48-96 hours after online publication and is updated daily on week days.
Initial download of the metrics may take a while.