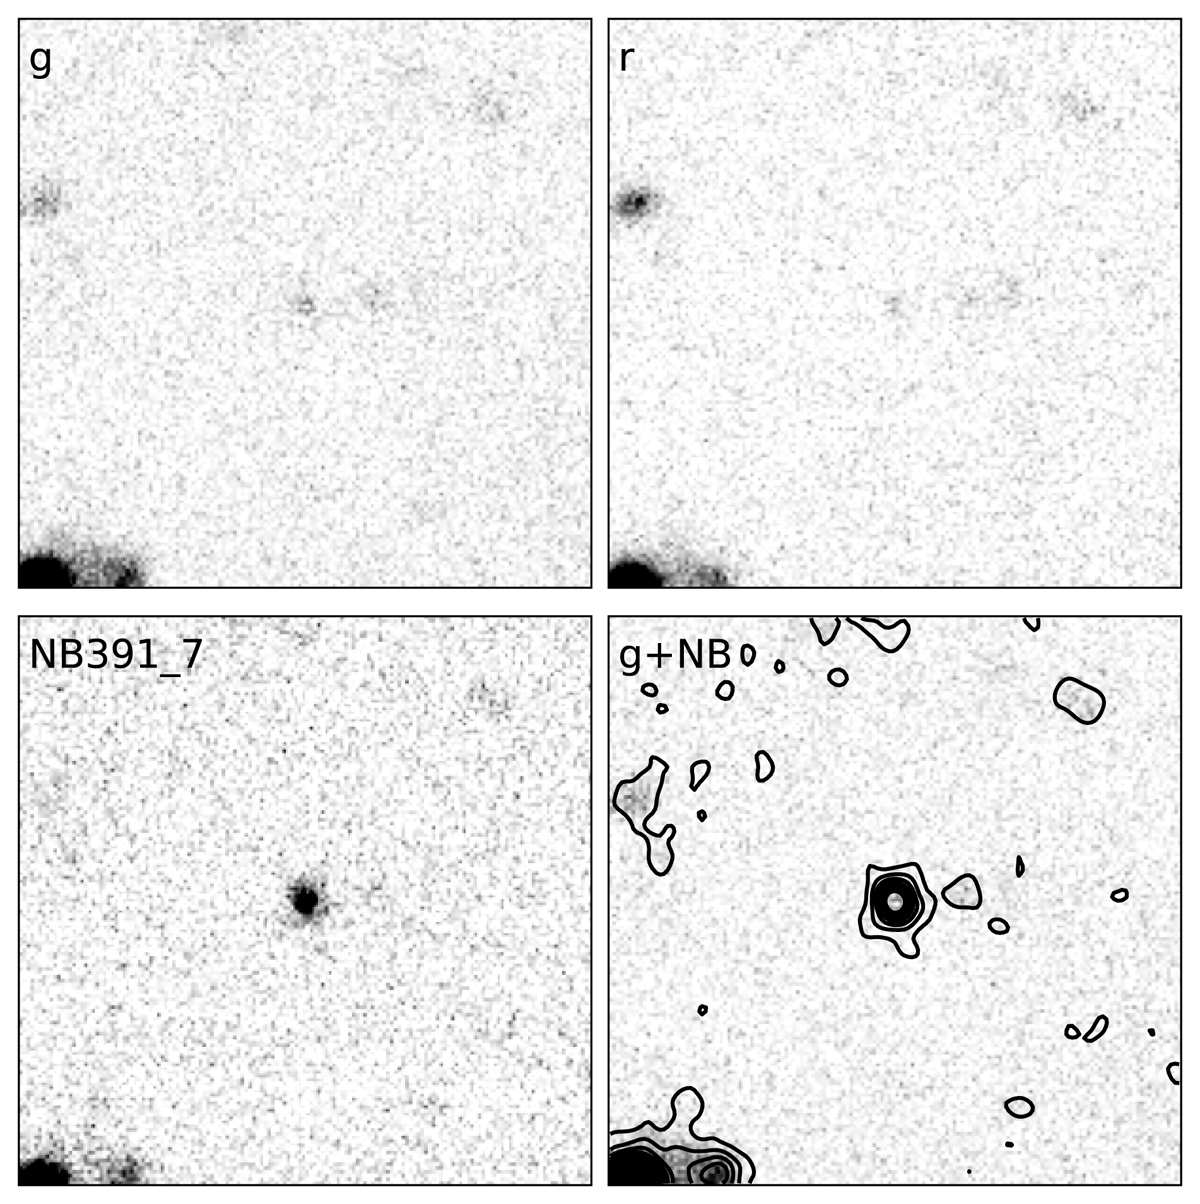
Fig. 7.
Download original image
32 × 32 arcsec2 region around the position of the strong emission line source we detect 90 arcsec south of Q 1218+0832. In the top row, we show the broad-band g and r images. The bottom left image shows the NB391_7 image. In the bottom right image, we overplotted linearly spaced contours of the NB391_7 image smoothed by a Gaussian kernel with a width equal to the seeing on top of the g-band image.
Current usage metrics show cumulative count of Article Views (full-text article views including HTML views, PDF and ePub downloads, according to the available data) and Abstracts Views on Vision4Press platform.
Data correspond to usage on the plateform after 2015. The current usage metrics is available 48-96 hours after online publication and is updated daily on week days.
Initial download of the metrics may take a while.