Fig. 1.
Download original image
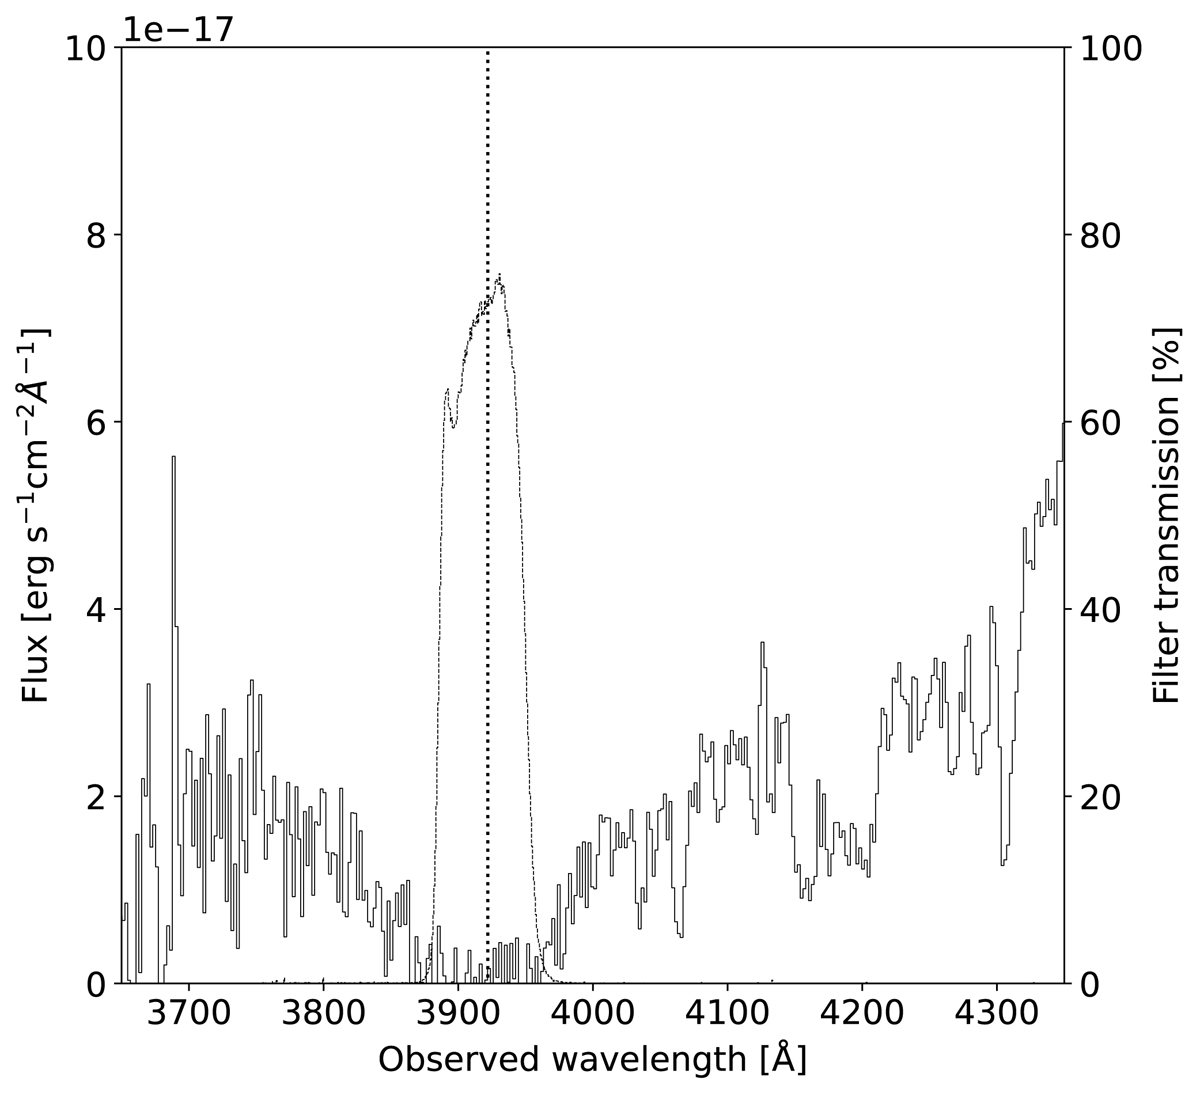
Region around the DLA in the spectrum of Q 1218+0832 shown together with the filter transmission curve (dotted line) of the 63 Å-wide narrow-band filter NB391_7 used in this study (see also Fig. 2 in Geier et al. 2019). The vertical dotted line shows the expected position of Lyman-α at the redshift of z = 2.2261 measured from low-ionisation metal lines in Geier et al. (2019). The filter, although designed for other purposes, matches the DLA trough perfectly.
Current usage metrics show cumulative count of Article Views (full-text article views including HTML views, PDF and ePub downloads, according to the available data) and Abstracts Views on Vision4Press platform.
Data correspond to usage on the plateform after 2015. The current usage metrics is available 48-96 hours after online publication and is updated daily on week days.
Initial download of the metrics may take a while.