Fig. 8
Download original image
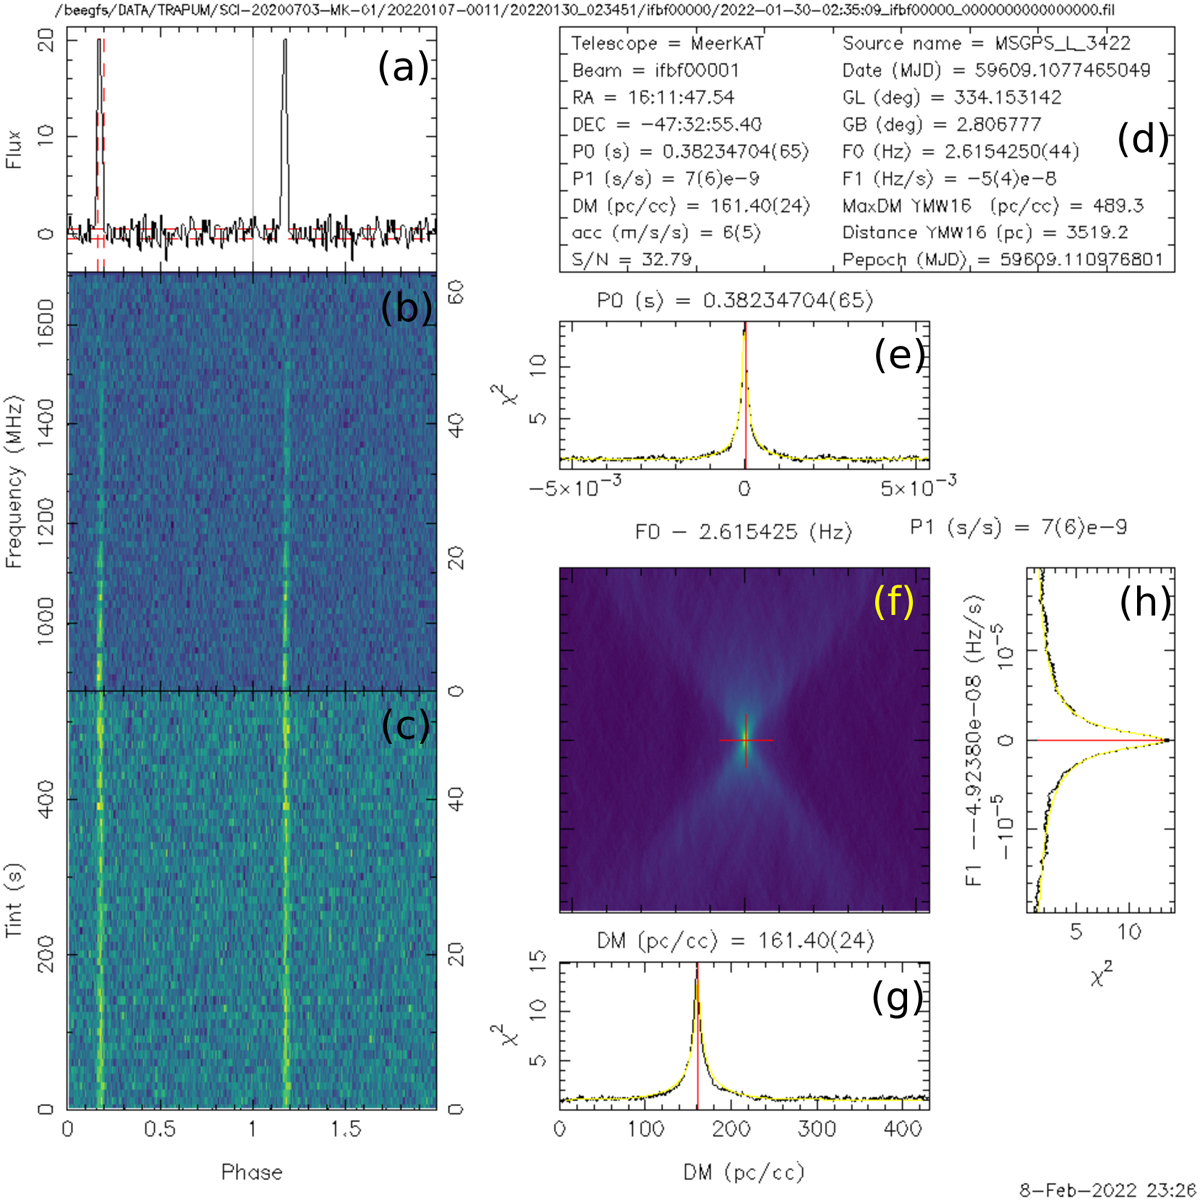
Candidate plot generated by the folding pipeline of MMGPS-L, showing a known pulsar, PSR B1609-47. The plot is divided into eight panels: Panel a shows the folded profile of a candidate, with the grey vertical span indicating intra-channel dispersion smearing and red lines indicating pulse and noise amplitudes. Panel b shows the frequency-phase spectrum with time spans integrated. Panel c shows the time-phase spectrum with frequency channels integrated. Panel d shows the meta-information of the observation and candidate. Panel e shows the χ2-ν relation. Panel f shows the χ2 spectrum of the v-![]() plane, with the red cross representing the pre-optimised ν and
plane, with the red cross representing the pre-optimised ν and ![]() . Panel g shows the χ2-DN relation. Panel h shows the
. Panel g shows the χ2-DN relation. Panel h shows the ![]() relation. In panels e, g, and h, the red line represents the pre-optimised value, and the yellow line shows the fitting curve of the relation under the assumption that the candidate’s profile is Gaussian with a pulse width estimated from the folded profile.
relation. In panels e, g, and h, the red line represents the pre-optimised value, and the yellow line shows the fitting curve of the relation under the assumption that the candidate’s profile is Gaussian with a pulse width estimated from the folded profile.
Current usage metrics show cumulative count of Article Views (full-text article views including HTML views, PDF and ePub downloads, according to the available data) and Abstracts Views on Vision4Press platform.
Data correspond to usage on the plateform after 2015. The current usage metrics is available 48-96 hours after online publication and is updated daily on week days.
Initial download of the metrics may take a while.