Fig. 7
Download original image
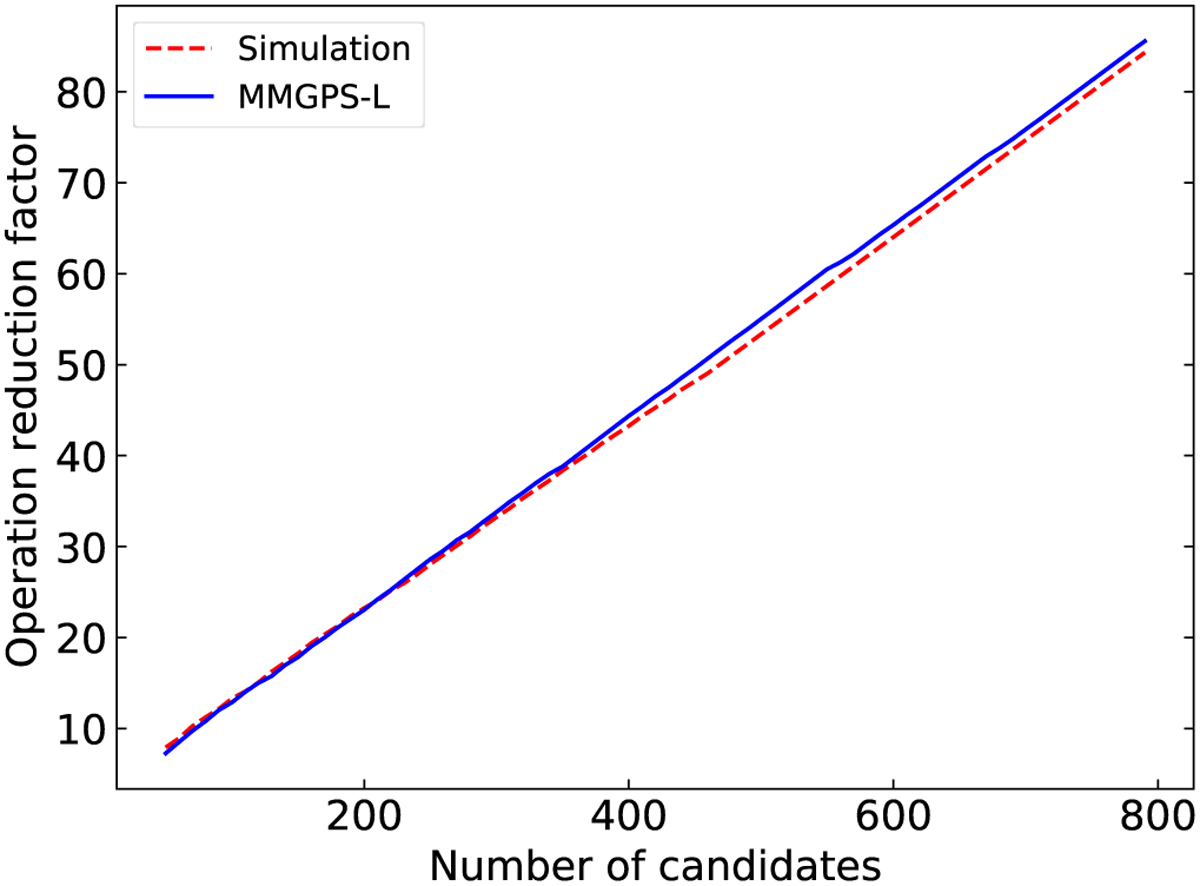
Operation reduced factor achieved by the pFDMT algorithm compared to the brute-force algorithm. The solid blue line represents the test data obtained from MMGPS-L, where the number of candidates is determined based on the S/N cutoff. The dashed red line represents the simulated data with an equally spaced distribution of DMs.
Current usage metrics show cumulative count of Article Views (full-text article views including HTML views, PDF and ePub downloads, according to the available data) and Abstracts Views on Vision4Press platform.
Data correspond to usage on the plateform after 2015. The current usage metrics is available 48-96 hours after online publication and is updated daily on week days.
Initial download of the metrics may take a while.