Fig. 5
Download original image
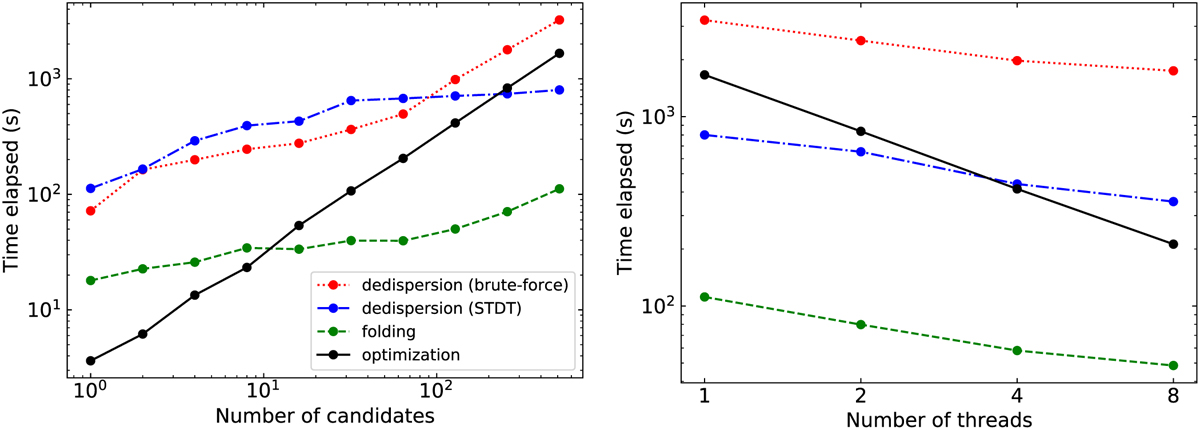
Benchmark results of the folding pipeline, which includes de-dispersion, folding, and optimisation processes. The left panel illustrates the relation between time consumption and the number of candidates running on a single thread. The right panel shows the relation between time consumption and the number of threads with 512 candidates. The dotted red line represents the brute-force de-dispersion, while the dash-dot blue line represents the pFDMT algorithm. The folding process is represented by the dashed green line, and the optimisation process is represented by the solid black line.
Current usage metrics show cumulative count of Article Views (full-text article views including HTML views, PDF and ePub downloads, according to the available data) and Abstracts Views on Vision4Press platform.
Data correspond to usage on the plateform after 2015. The current usage metrics is available 48-96 hours after online publication and is updated daily on week days.
Initial download of the metrics may take a while.