Fig. 3
Download original image
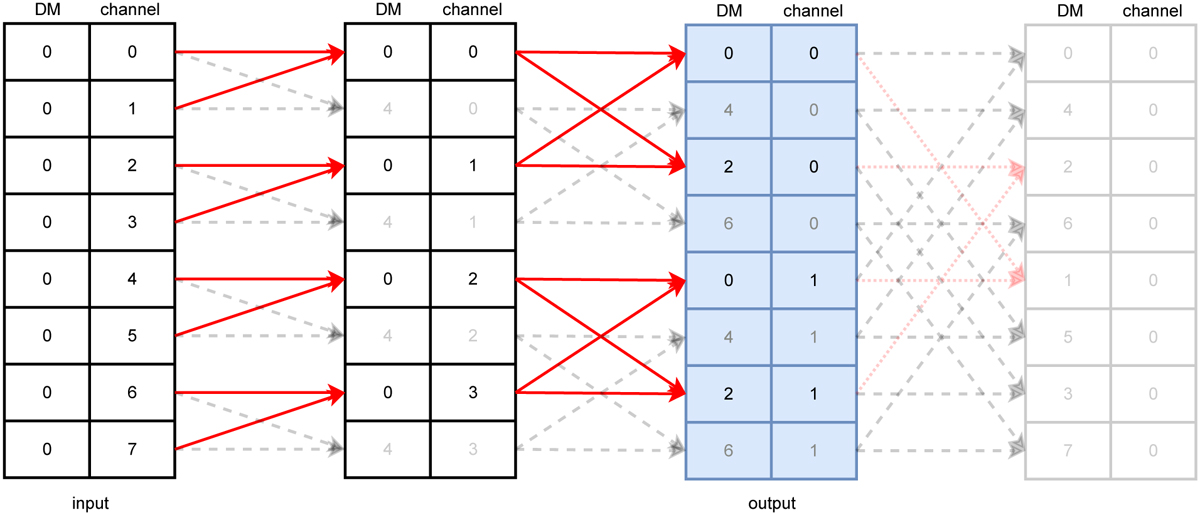
Example of the pFDMT algorithm using eight frequency channels. The de-dispersion is only applied to DM = [1, 2], resulting in a de-dispersed sub-band data of two frequency channels. The output data are shaded in blue. The start DM is 0 and the DM step is 1, both of which can be adjusted. The solid red line indicates that the ‘atomic de-dispersion’ is non-pruned, while a translucent dashed black line or dotted red line indicate that it is pruned. The translucent dotted red line represents the pruned atomic de-dispersion in the final stage, which is not used as only sub-band data are needed.
Current usage metrics show cumulative count of Article Views (full-text article views including HTML views, PDF and ePub downloads, according to the available data) and Abstracts Views on Vision4Press platform.
Data correspond to usage on the plateform after 2015. The current usage metrics is available 48-96 hours after online publication and is updated daily on week days.
Initial download of the metrics may take a while.