Fig. B.3
Download original image
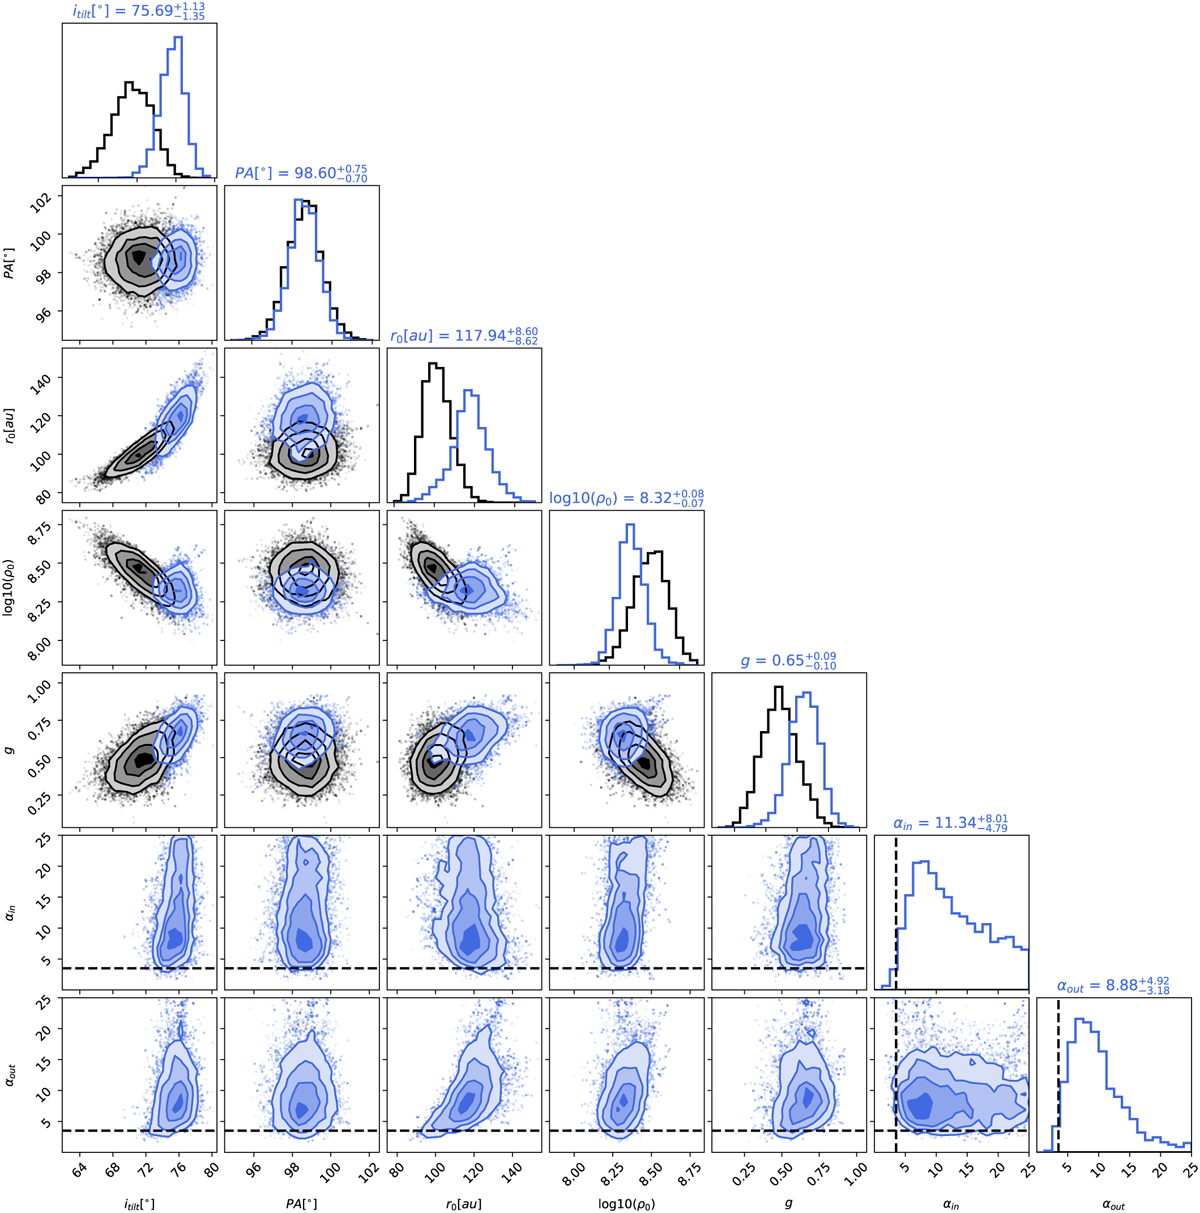
As Fig. B.2, but for the radial structure fit (blue; Sect. 5.5). The dashed black lines indicate the fixed values of αin and αout for the 5-parameter fit. The posterior for αout is moderatley constrained; for αin values ≲10 are strongly disfavored, but higher values follow the prior. We infer that the disk profile is steep, but the extent of the sharpness is hard to constrain. Notably, the r0 value is somewhat higher for this fit, as discussed in detail in Sect. 5.5. The disk inclination value is also higher in this case, following the clear correlation of r0 and itilt also highlighted in Fig. B.1.
Current usage metrics show cumulative count of Article Views (full-text article views including HTML views, PDF and ePub downloads, according to the available data) and Abstracts Views on Vision4Press platform.
Data correspond to usage on the plateform after 2015. The current usage metrics is available 48-96 hours after online publication and is updated daily on week days.
Initial download of the metrics may take a while.